Dec 11, 2024
Products
Numerical Simulation Technology for Enhancing LM Guide Accuracy

The LM Guide first debuted on the market in its current form in 1973. During the just over 50 years since, it rapidly became ubiquitous around the world in machine tools and a variety of other fields besides. Today, the LM Guide is essentially synonymous with linear motion and its use is widely taken as a given. That said, the changing needs that have accompanied market expansion have been the impetus for a wider range of available sizes, more varied product concepts, and numerous combinations of optional features that have collectively resulted in a vast variety of LM Guide products on offer. From a customer’s perspective, though, selecting the appropriate LM Guide to build a machine that meets their requirements from this vast array poses a challenge. There are performance factors like service life and rigidity as well as dimensional constraints to consider, to say nothing of cost and lead times that must also be taken into account. This is where THK steps in as a manufacturer to offer different types of technical support.
This time, we’ll be looking at things from a slightly different perspective. Instead of focusing on product development, we’ll be shifting our gaze to numerical simulation as a means of enhancing LM Guide accuracy and the technology used to power it.
Load Distribution Theory: The Core of THK’s Numerical Simulation
When it comes to the LM Guide, three types of performance are paramount: running accuracy, rigidity, and service life. The first step to simulating these is knowing the load applied to each of the rolling elements (balls or rollers) built into the LM Guide. In order to calculate these individual loads, we use what’s called load distribution theory.
Enhancing the Accuracy of Load Distribution Theory Using FEM
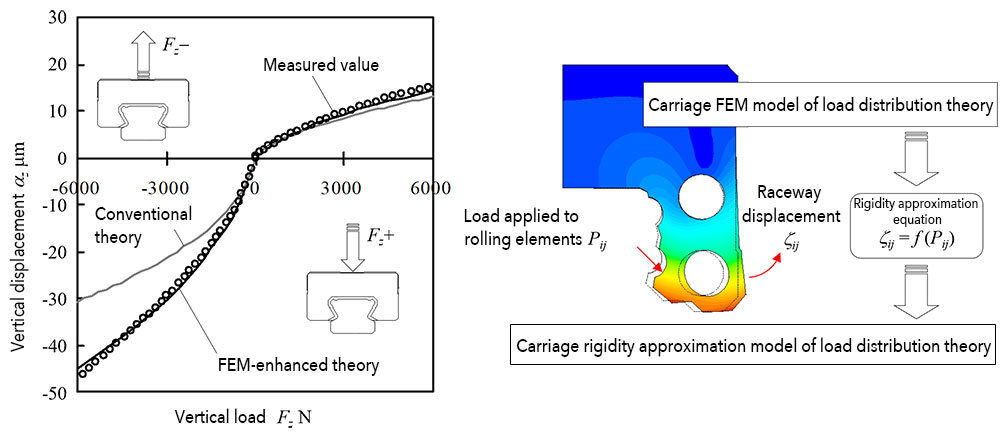
In load distribution theory, the amount of elastic deformation experienced by the rolling elements and raceway surface of an LM Guide is determined using principles from the fields of geometry and mechanics of materials. The load applied to the rolling elements is then calculated using Hertzian contact theory. What is crucial here is the deformation of the LM block and the LM rail in question. But the shape of an LM block in particular is complex, making it impossible to accurately calculate deformation with a simple mechanics of materials approach. To account for this, we can use a technique for numerical analysis called the finite element method (FEM) to enhance analytical accuracy, forming what can be called a carriage FEM model of load distribution theory. Still, if we want to use this model of load distribution theory for applied analysis, the amount of time required for analysis becomes a problem. Because of this, we are currently developing a carriage rigidity approximation model of load distribution theory, which will provide the same level of analytical accuracy as the carriage FEM model while drastically reducing how long analysis takes.
The graph below shows the results of a rigidity simulation based on the new analytical theory developed by THK. We can see that these results are closer to the actual measured values than those yielded by a simulation based on the conventional theory.
An Example of Applied Analysis Contributing to Greater LM Guide Running Accuracy
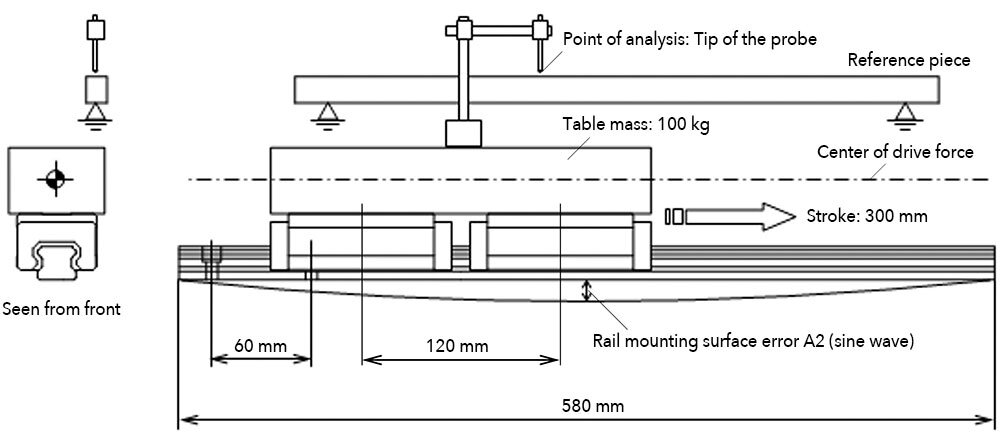
Let’s look at an example analysis of LM Guide running accuracy that uses load distribution theory. Picture an LM Guide system composed of one LM rail and two LM blocks that has a 100 kg table fastened onto it. Now imagine that there is concave sinusoidal error on the mounting surface for the LM rail.
The graph below shows the results of an analysis of the path followed by the tip of the probe that serves as the point of analysis in this scenario. One of the first things we notice on this graph is that the analysis results are only one third of the actual error. This is due to what’s called the precision averaging effect, where the running accuracy of the guide is ultimately better than the accuracy of the mounting surface. It looks as though the results of the simulation do a good job of capturing this phenomenon.
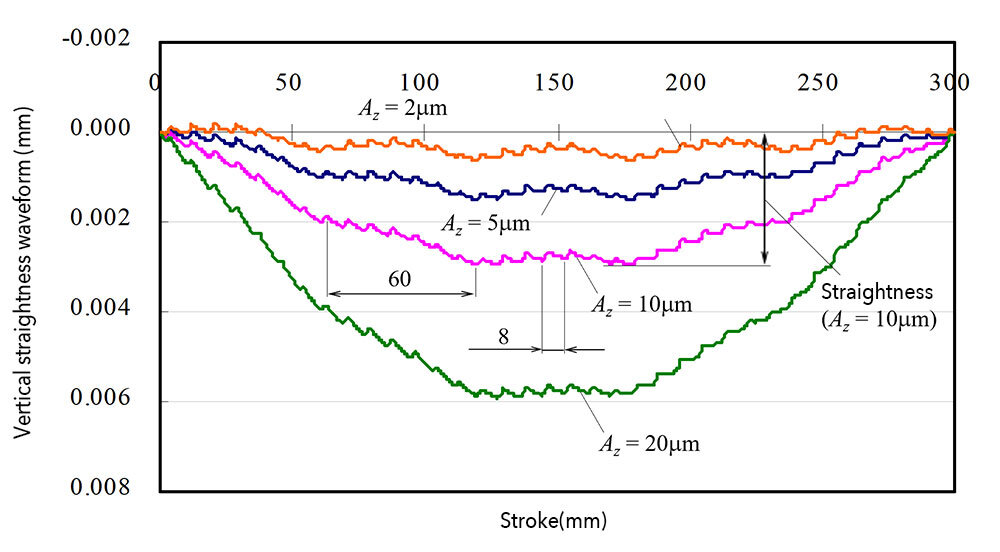
Furthermore, we can see localized mid-size waves that are 60 mm in length and smaller ones 8 mm in length within the span of the larger concave-up waveform on the graph. The mid-size waves are caused by some sinking in that happens when the rail is bolted down to the surface, whereas the smaller ones reflect waving caused by the circulation of the rolling elements.
Approaches to Enhancing LM Guide Accuracy
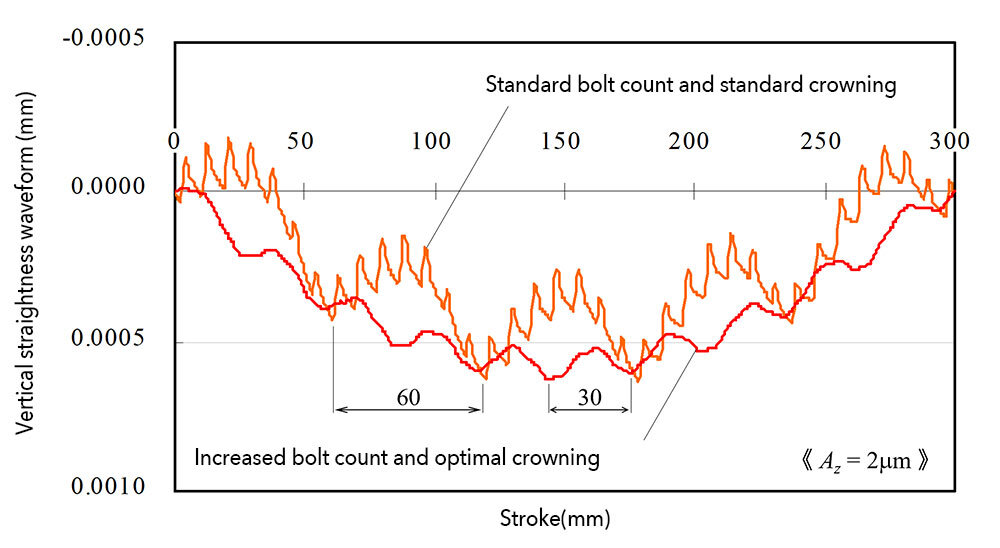
What we can see from the results of the example analysis above is that the running accuracy is greater than the mounting surface accuracy such that it only has one third of the error. However, we also see the impact of waving and having the rail bolted down reflected as waves on the graph, and these become particularly apparent when there is only a small amount of error on the mounting surface. Below, we’ll look at an experiment with an even more accurate LM Guide suggested for reducing the impact of these factors where the error on the mounting surface is 2 μm.
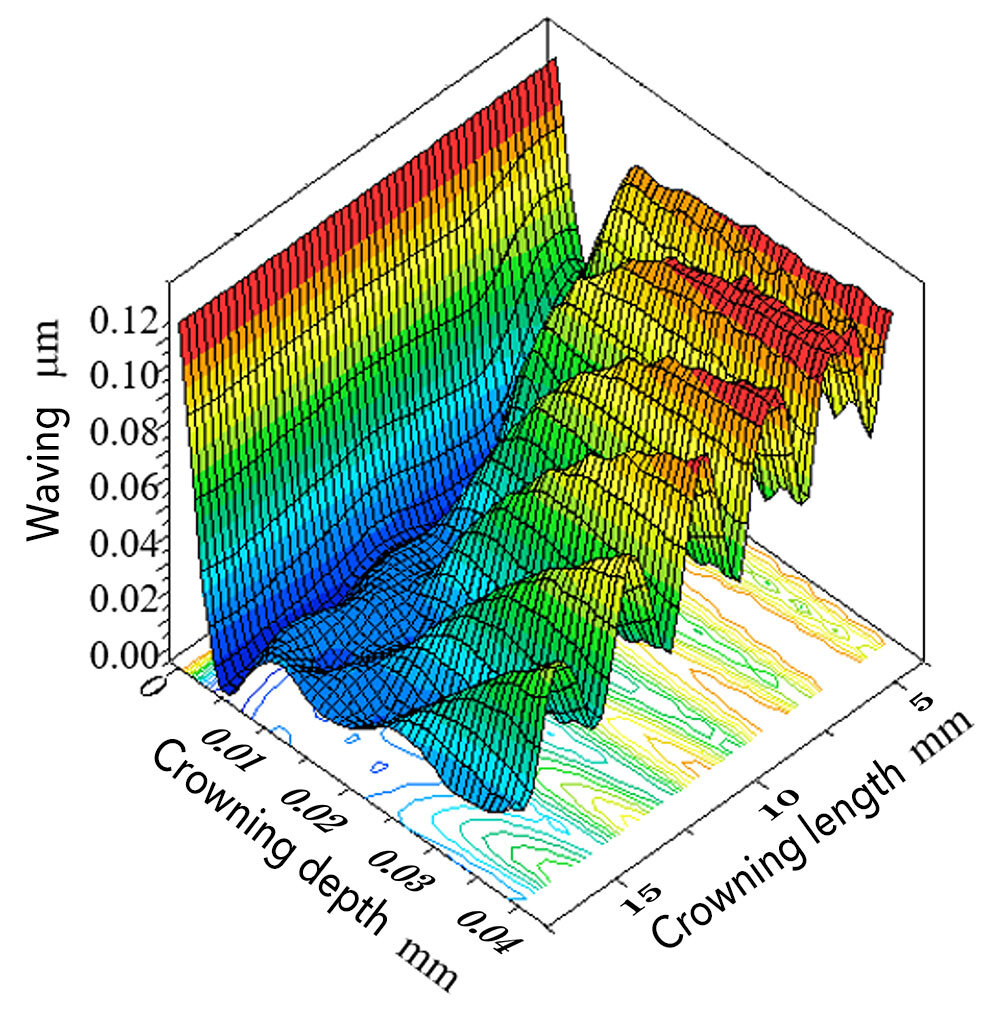
First, we tried to reduce the impact of bolting down the rail by increasing the number of bolts. There are several methods we could have used to reduce the impact of waving, but this time we chose to optimize the crowning dimensions. Crowning is a type of chamfering process performed on the edges of an LM block. At THK, it has been made clear for some time that crowning length and depth affect waving, and we’re currently creating a technique for determining optimal crowning dimensions using an evolutionary algorithm with sample data obtained using mixed-level factorial design.
The graph below shows the results of a new running accuracy analysis performed on an LM Guide with optimized crowning and more bolts used to mount the rail. We can see that the impact of bolting down the rail has been reduced and the effect of waving has become minuscule.
Analysis with Peripheral Components
Up to this point, we’ve looked at load distribution theory, the core of our simulation technology, as well as methods for analyzing running accuracy and crowning that put the theory to work. These analyses focus solely on the LM Guide, but in an actual use case, the guide would be substantially affected by the presence of attached peripheral components. In some situations, this could change the service life of the LM Guide considerably. The image below provides an example of load distribution analysis that accounts for the deformation of a base and a table attached to the LM Guide.
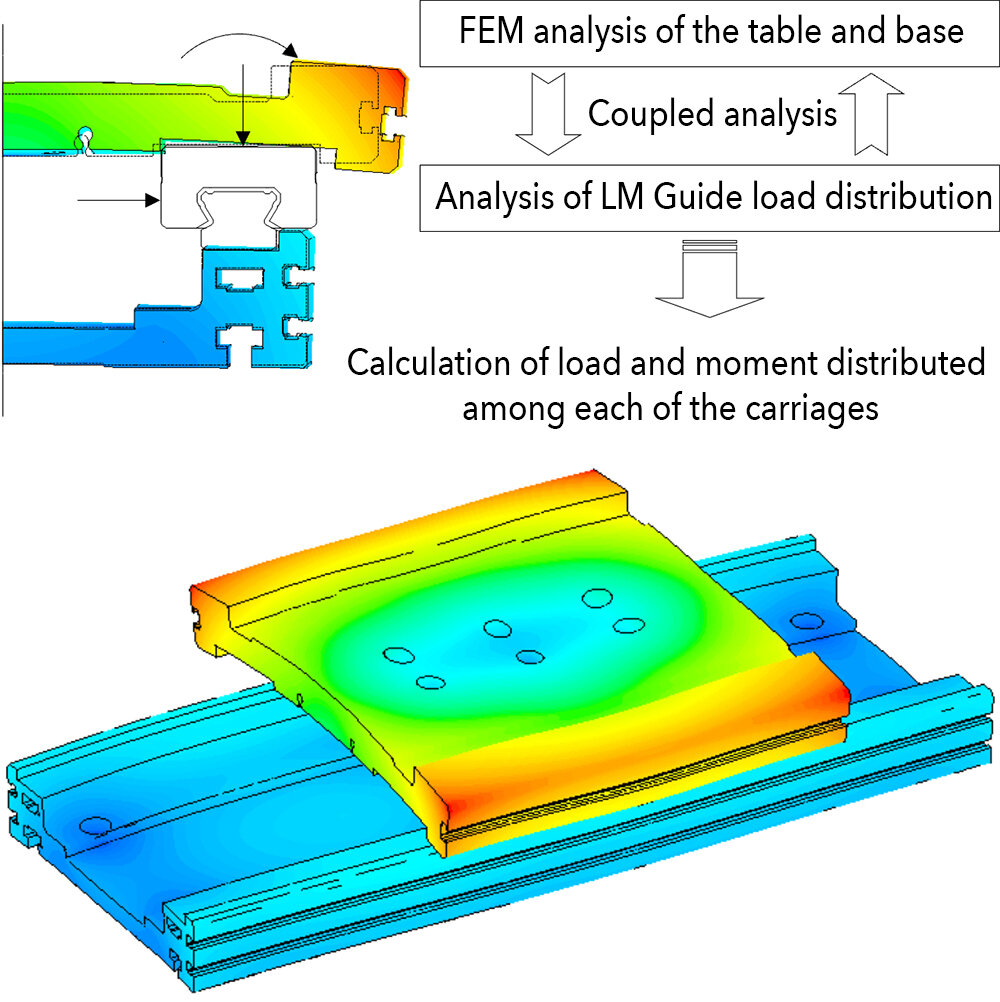
Currently, we have expanded the range of our analysis to include not only peripheral components attached to an LM Guide, but the whole machine onto which the LM Guide is installed. As mentioned at the beginning of this article, running accuracy, rigidity, and service life are paramount for an LM Guide. In order to measure these performance factors more accurately, we are working day in and day out to enhance the accuracy of our analytical methods.
Click here for an introduction to THK Online Services (THK website)
THK Online Services features technical support tools for the THK product catalog and instruction manuals, CAD data, product FAQ, technical materials, product selection, and service life calculation.
* Those who do not have an ID must register for a free account before using.
* There are two types of members (full members and guest members).
Contact information
THK LM SYSTEM Pte. Ltd.
38 Kaki Bukit Place LM Techno Building Singapore 416216
Tel: +65-6884-5500 / Fax:+65-6884-5550
E-Mail:sales@thksg.com