


Major Financial Data
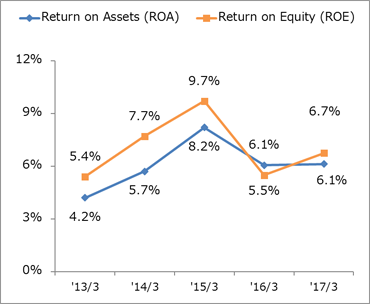
ROA, ROE
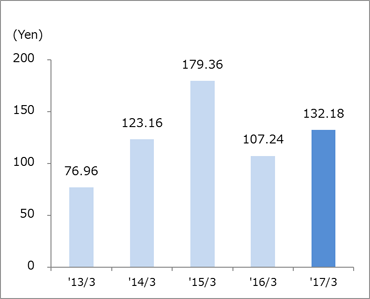
Earnings Per Share
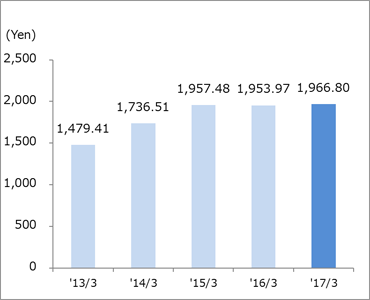
Book-value per Share
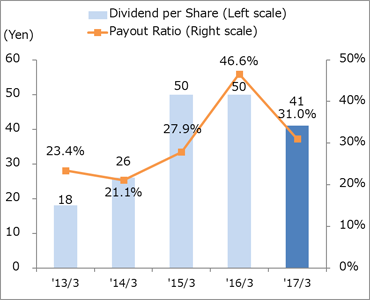
Dividend per Share, Payout Ratio
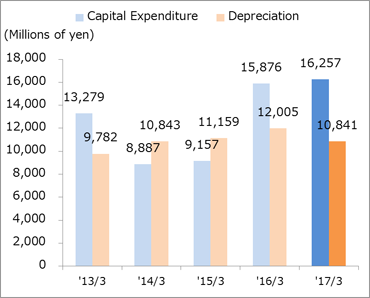
Capital Expenditure, Depreciation
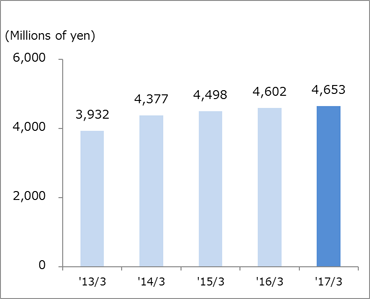
R&D Expenses
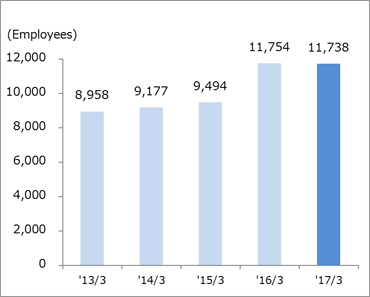
Number of Employees at End of Periods
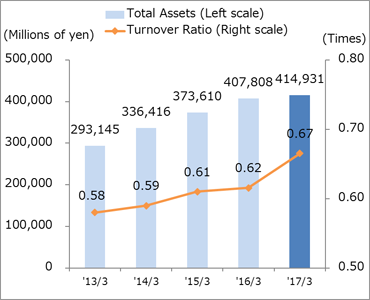
Total Assets, Turnover Ratio
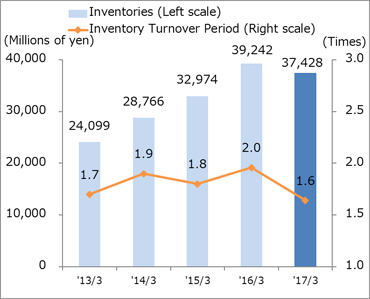
Inventory, Inventory Turnover Period (Months)
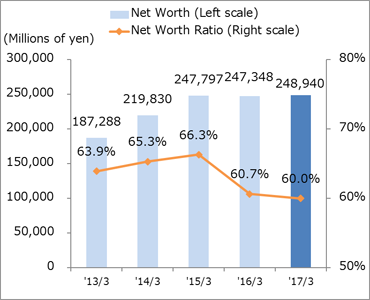
Net Worth Ratio
Millions of yen,Yen,Employees
| '13/3 | '14/3 | '15/3 | '16/3 | '17/3 | |
|---|---|---|---|---|---|
| Return on Assets (ROA) | 4.2% | 5.7% | 8.2% | 6.1% | 6.1% |
| Return on Equity (ROE) | 5.4% | 7.7% | 9.7% | 5.5% | 6.7% |
| Earnings per Share | 76.96 | 123.16 | 179.36 | 107.24 | 132.18 |
| Book-value per Share | 1,479.41 | 1,736.51 | 1,957.48 | 1,953.97 | 1,966.80 |
| Dividend per Share | 18 | 26 | 50 | 50 | 41 |
| Payout Ratio | 23.4% | 21.1% | 27.9% | 46.6% | 31.0% |
| Capital Expenditure* | 13,279 | 8,887 | 9,157 | 15,876 | 16,257 |
| Depreciation* | 9,782 | 10,843 | 11,159 | 12,005 | 10,841 |
| R&D Expenses | 3,932 | 4,377 | 4,498 | 4,602 | 4,653 |
| Number of Employees at End of Periods | 8,958 | 9,177 | 9,494 | 11,754 | 11,738 |
| Turnover Ratio | 0.58 | 0.59 | 0.61 | 0.62 | 0.67 |
| Inventory Turnover Period (Months) | 1.7 | 1.9 | 1.8 | 2.0 | 1.6 |
| Net Worth Ratio | 63.9% | 65.3% | 66.3% | 60.7% | 60.0% |
*Capital Expenditure and Depreciation figures represent only those for property, and equipment
The figures for 16/3 do not include the results by THK RHYTHM AUTOMOTIVE.
The figures for 16/3 do not include the results by THK RHYTHM AUTOMOTIVE.