

OEE Optimization System

GX Solution
for each line and machine!
Green transformation for factories
with an operations-based approach.
energy demand
energy use
by machine category
energy use
Visually monitor
your energy use!
Many countries have declared their intentions to go carbon neutral and achieve zero greenhouse gas (GHG) emissions.
To achieve a carbon neutral society through GX (green transformation),it's critical that companies first achieve visibility
for the locations and production lines that have the highest GHG emissions to understand how much they can reduce.
What is GX?
GX (green transformation) refers to activities related to transforming our society into one that uses renewable, clean energy sources to achieve decarbonization.
What is carbon neutrality?
Going carbon neutral means achieving net-zero GHG emissions.
To achieve a carbon-neutral society, companies have to both see the volume of their GHG emissions and reduce it.
Are there standards for calculating GHG emissions?
The international standards for GHG calculations include Scope 1, Scope 2, and Scope 3 emissions.
In addition to the Scope 1 and 2 emission measurements focused on individual companies, more attention is being placed on Scope 3 emissions, which include data from other companies in the supply chain.
Have you run into these problems when trying to measure your factory's energy use?
Problems for engineers
Wiring work is difficult and an obstacle for energy monitoring.
Line upgrades and machine changes happen all the time. You want to implement an energy monitoring system, but operating it would be difficult because it would be expensive and require the machine to be set up for communication.
You want to quickly aggregate energy use.
You want to quickly compile quantitative data about how energy use has changed after upgrading or changing machines.
You want to see detailed energy use for individual production devices or by machine categories that you set.
You're currently calculating energy use based on invoices from the power company. You want to look up detailed information about individual devices and establish a policy to reduce their energy use.
You currently can only capture data from the switchgear, not detailed machine information.
Our GX Solution is the answer!
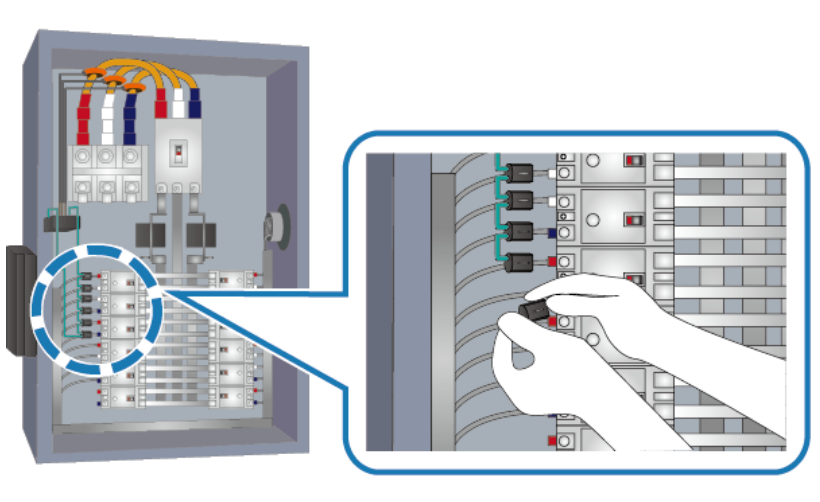
User-friendly with minimal wiring.
The sensors are daisy-chained together to minimize wiring and take up less space so they can fit inside narrow distribution boards.
THK has proposed solutions for factories employing automation for many years, and with our focus on operational needs, we offer hardware that won't get in the way of regular maintenance and inspections.

Reduces wiring work/Easier to manage
Group sensors by machine units the way you want.
The sensor grouping feature makes it easy to calculate energy consumption rates based on machine category.
If the way you calculate machine energy use changes frequently due to moving or adding equipment, the GX Solution is for you!

Makes data aggregation easier
Problems for executives and monitors of GHG emissions
You want to report energy data internally, but these systems are expensive, and it's hard to decide which one to buy and when.
Frequent updates to production lines and equipment make it difficult to maintain a power monitoring system, especially when each change requires costly communication infrastructure work. The high implementation and operational costs pose a significant barrier.
Our GX Solution is the answer!
The only system setup required is to turn the power on!
Just like with OMNIedge, a dedicated communication network is provided, so you can get started without having to set up a network for your existing equipment.
If you frequently have to set up a network to capture data every time you upgrade or add equipment, the GX Solution is for you!

Reduces network setup costs/Makes it easier to move machines
Problems for maintenance and production personnel
Your hands are full with maintenance and you can't get around to monitoring energy.
The maintenance department is responsible for both maintaining machines and monitoring energy use. You can't keep up with both, so before you realize it, your energy demand has exceeded the permissible amount, and your energy rates go up the next year.
Our GX Solution is the answer!
Alerts
With real-time demand monitoring, you will receive an alert on the screen when energy use approaches a predetermined threshold.
If you have problems with excessive demand, the GX Solution is for you!

Controls energy rate increases
Contact THK for a consultation and detailed pricing.
What is the GX Solution?
An Overview of the Hardware Configuration and Online Application
Hardware Configuration
THK pre-selects the hardware required for energy monitoring. No need to set up communications!
Three types of sensors are available to accommodate the target equipment's wire diameter and current range.
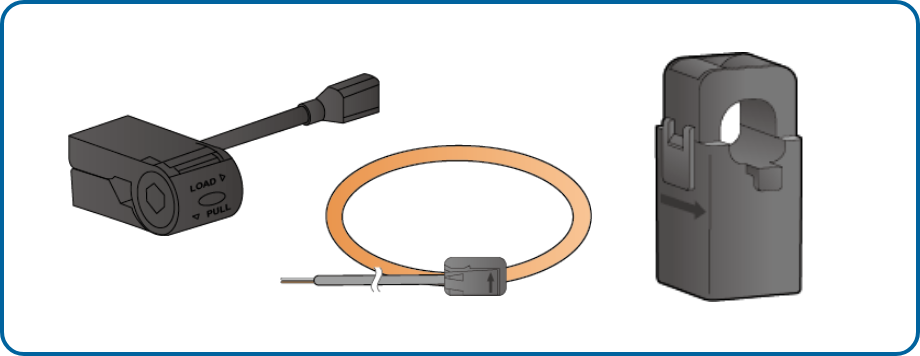
The sensors attach to your existing distribution boards, and they're daisy-chained to allow simple, compact installation even in tight spaces!
- A dedicated gateway is installed on each distribution board.
- Consolidates sensor data and sends it to a dedicated cloud environment.
- Power can be supplied directly from the distribution board.
- No communication setup is required, as a dedicated network is used.
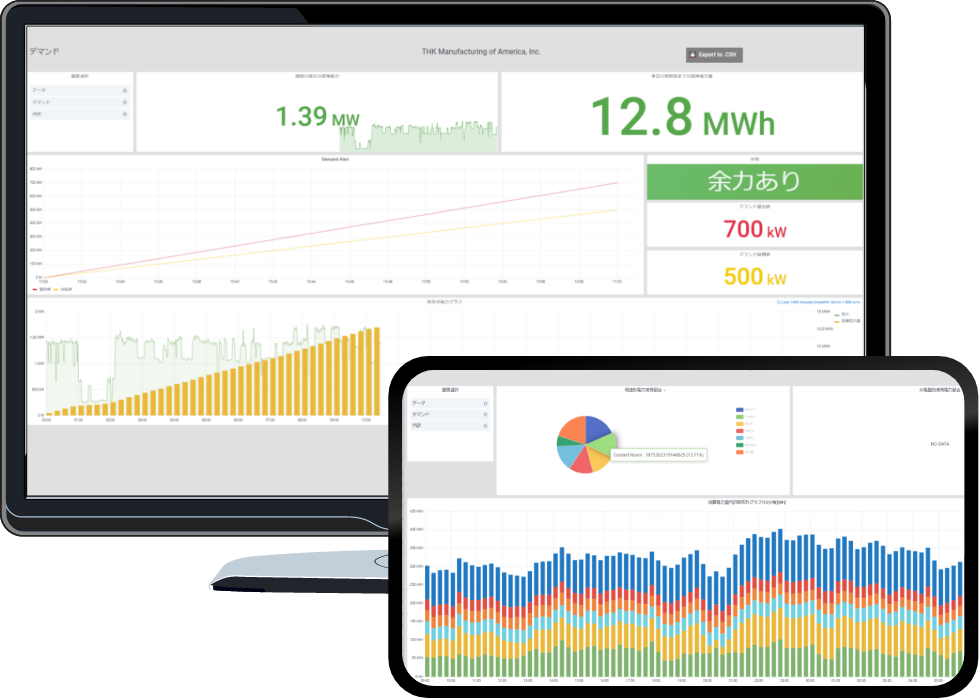
Online Application
Energy measurements can be reviewed through the browser app.
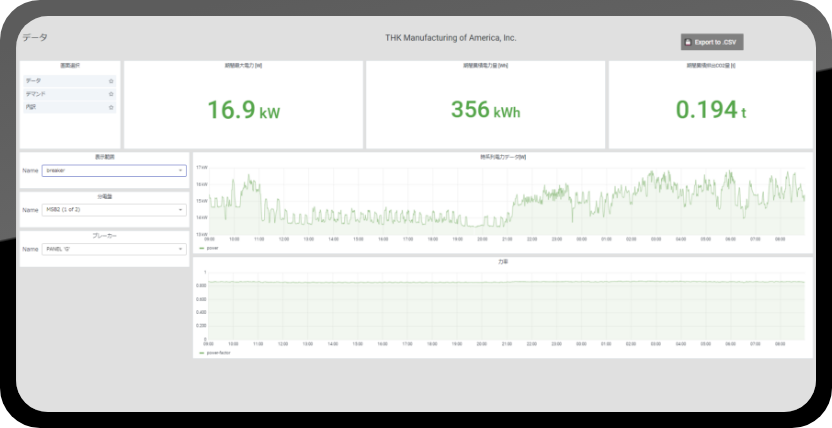
Data Screen
By selecting the building, distribution board, breakers, and time period you want to see, you can display their energy use, power factor, and CO2 emissions based on energy use. You can also export CSV data for easier reporting.
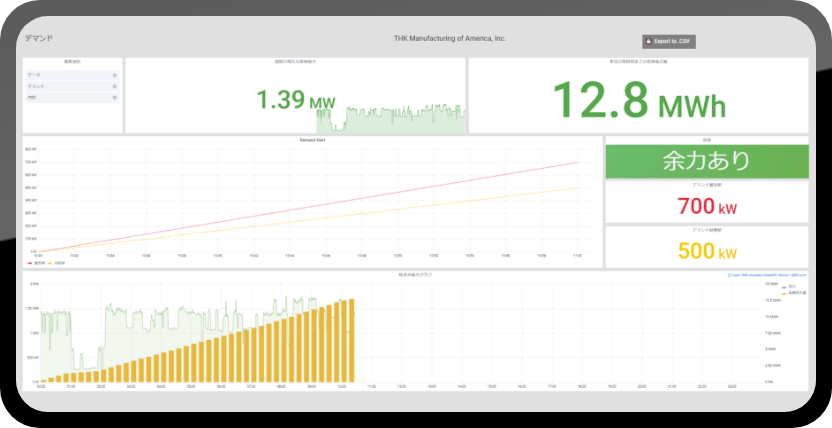
Demand Screen
Demand is monitored in real time, and an alert will be sent if it appears it will exceed the set threshold.
This helps avoid rate increases from excessive energy use and facilitates effective energy monitoring.
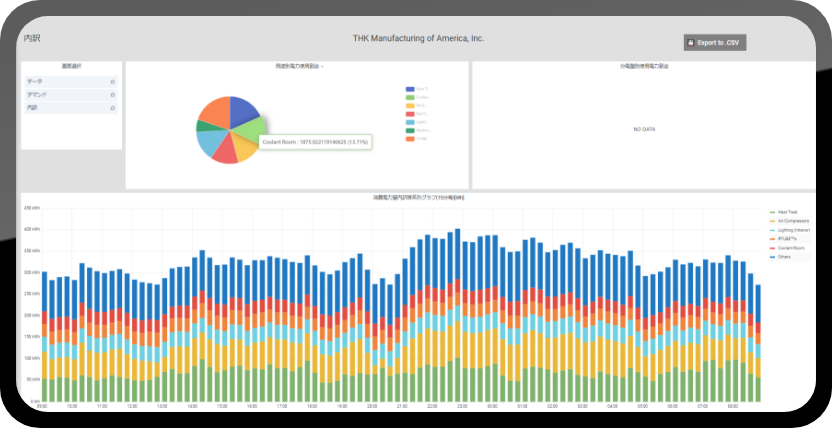
Details Screen
You can group sensors by machine category and see a breakdown of energy utilization in units you choose.
This way, you can freely calculate energy use by line or machine group without being limited by the actual device configuration within the distribution board.
Contact THK for a consultation and detailed pricing.
Use case
Preventing Excessive Energy Demand
The person in charge at the factory sees an excessive demand warning,
and they keep demand from exceeding the threshold by temporarily cutting power to extra equipment that won't impact production.

Visualizing Energy Consumption and Evaluating Improvement Efforts
Visualizes how much energy is being used by which equipment and when so you can see when wasteful consumption is occurring.
This lets you work with your production division to streamline energy consumption, and you can compare energy use before and after an improvement is made to quantitatively evaluate its effectiveness.

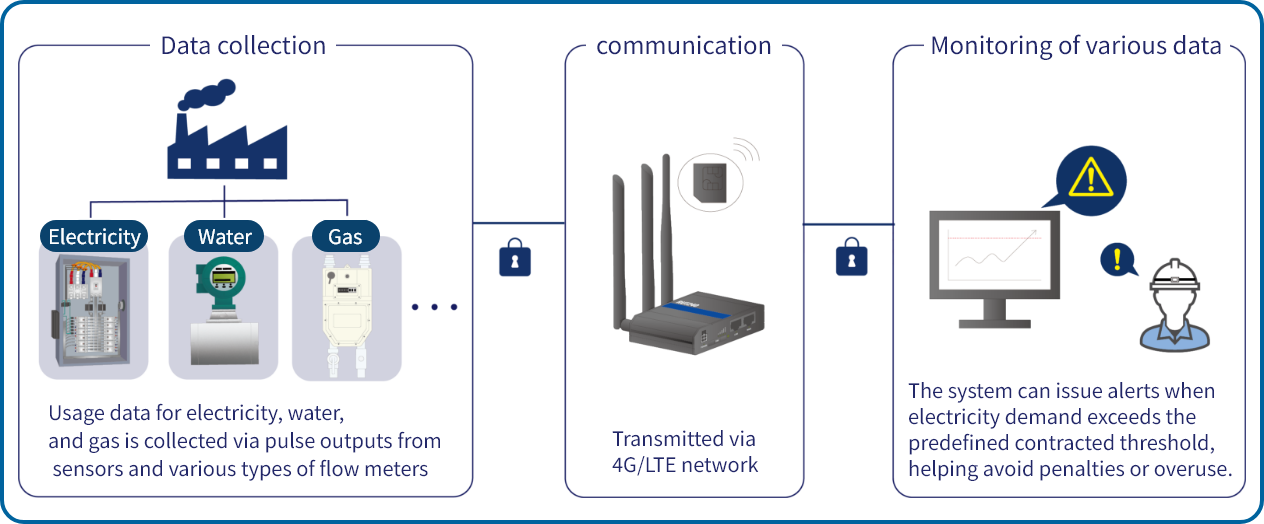
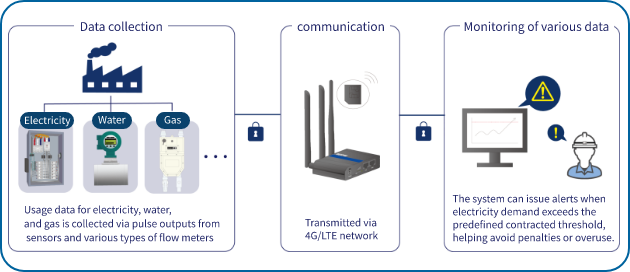
Integrating water and gas usage data
By collecting usage data such as electricity, water, and gas through pulse outputs from sensors and various flow meters, our GX Solution flexibly supports the visualization of GHG emissions across the factory.

Support
Installation in as little as two months/Comprehensive support structure
Initial Meeting
Interview about challenges
Introduction of the service
Establishment of structure to promote installation
On-Site Inspection and Official Quote
THK sales and engineering staff check the site
Confirmation of configuration and device quantity required for setup (takes about 1/2 day)
* Can be done while facility is in operation
Ordering
Construction
Takes one to a few business days.
Customers must arrange or perform their own electrical work.
THK will have a preparatory meeting with the party that performs that work and share a blueprint of what needs to be done.
Start of
Implementation
User Support
THK explains how to edit and operate the screens based on your machine names, and the sales team will follow up after implementation.