Cash Flows
*Effective from the fiscal year ending December 31, 2025, the automotive & transportation business has been classified as a discontinued operation.
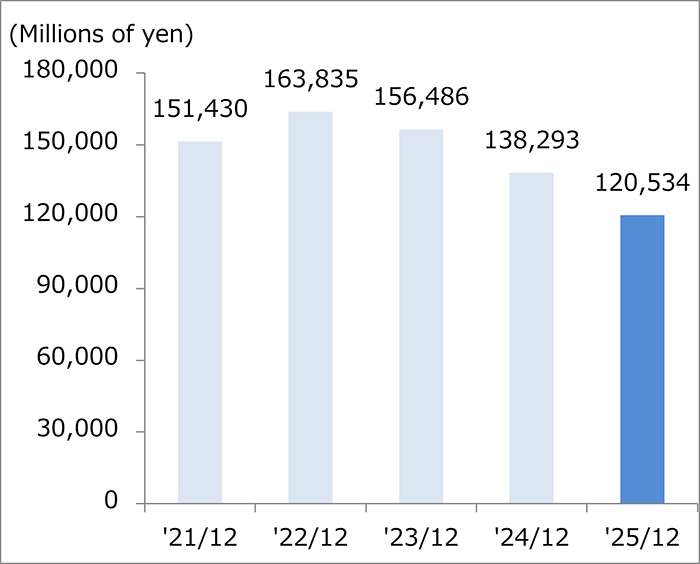
Cash and Cash Equivalents at End of Year
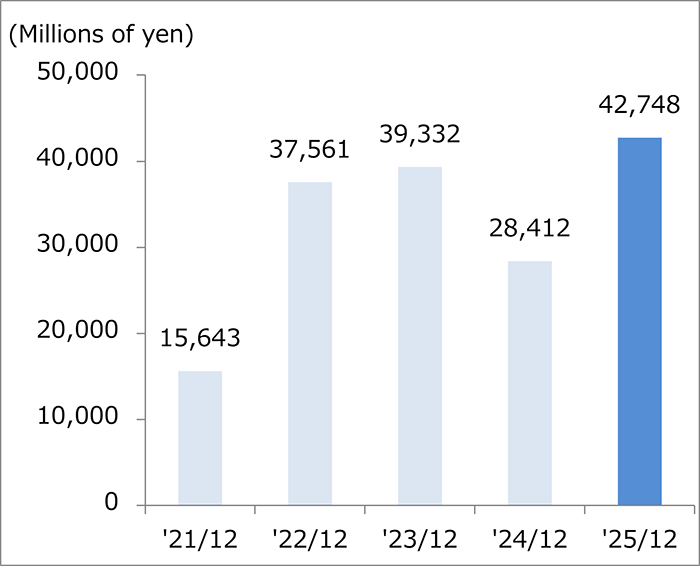
Cash Flows from Operating Activities
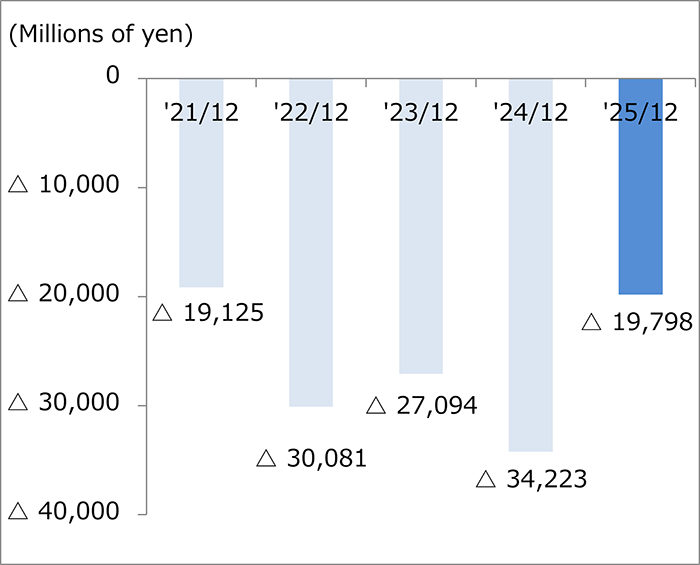
Cash Flows from Investing Activities
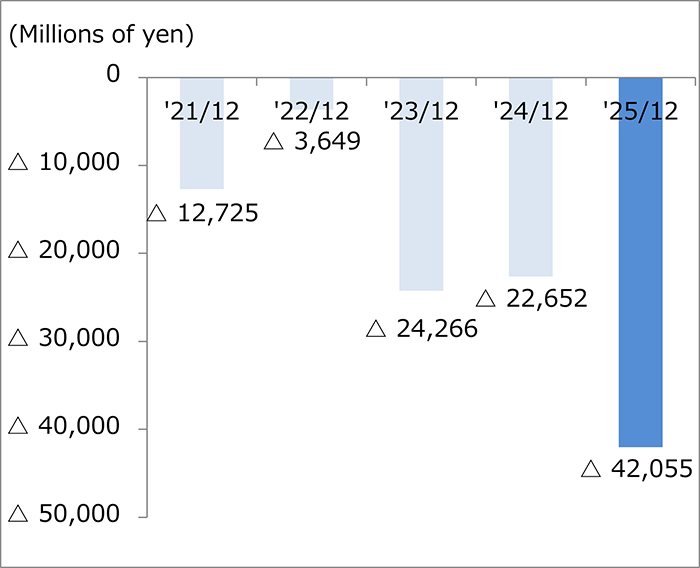
Cash Flows from Financing Activities
Millions of yen
|
'21/12 |
'22/12 |
'23/12 |
'24/12 |
'25/12 |
|
|---|---|---|---|---|---|
|
Cash and Cash Equivalents at End of Year |
151,430 |
163,835 |
156,486 |
138,293 |
120,534 |
|
Cash Flows from Operating Activities |
15,643 |
37,561 |
39,332 |
28,412 |
42,748 |
|
Cash Flows from Investing Activities |
△ 19,125 |
△ 30,081 |
△ 27,094 |
△ 34,223 |
△ 19,798 |
|
Cash Flows from Financing Activities |
△ 12,725 |
△ 3,649 |
△ 24,266 |
△ 22,652 |
△ 42,055 |