Performance Overview
*Effective from the fiscal year ending December 31, 2025, the automotive & transportation business has been classified as a discontinued operation. Therefore, revenue, operating income, and profit before tax in the table below represent amounts from continuing operations and exclude amounts from the discontinued operation, whereas profit attributable to owners of the parent is presented at the total amount of the continuing operations and discontinued operation. The changes have also been reflected in the fiscal year ending December 31, 2024.
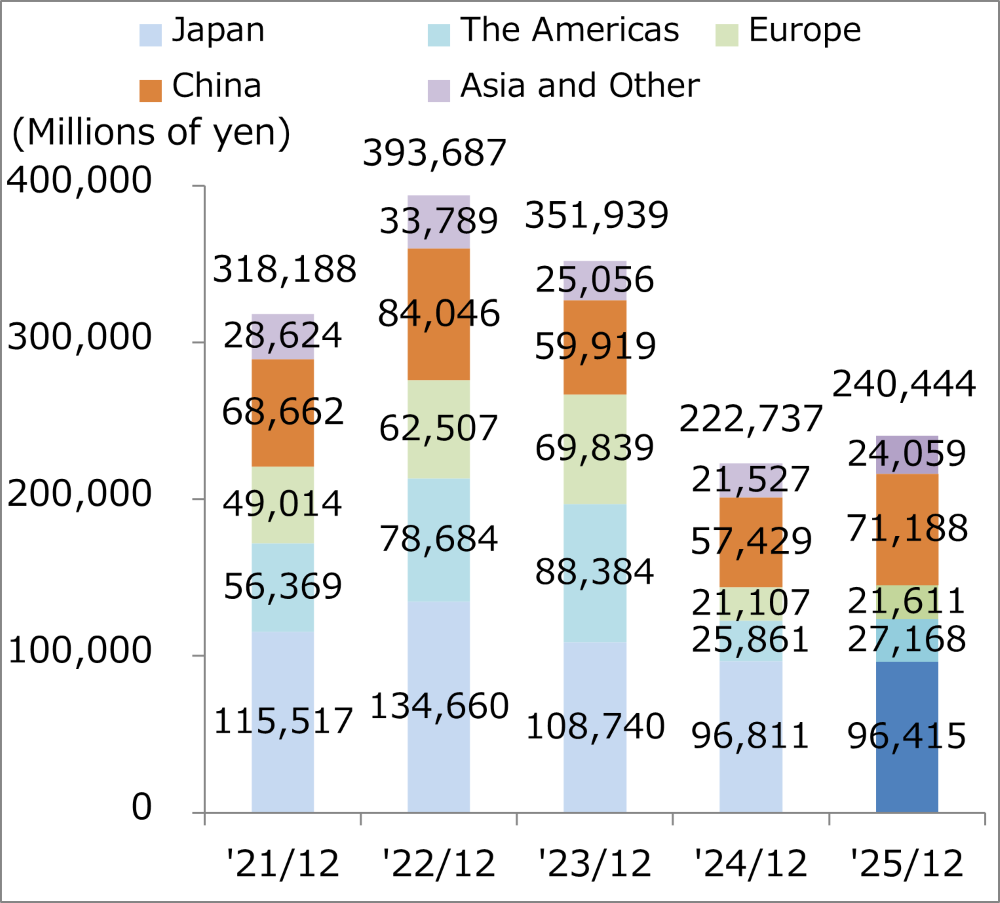
Breakdown of Consolidated Revenue
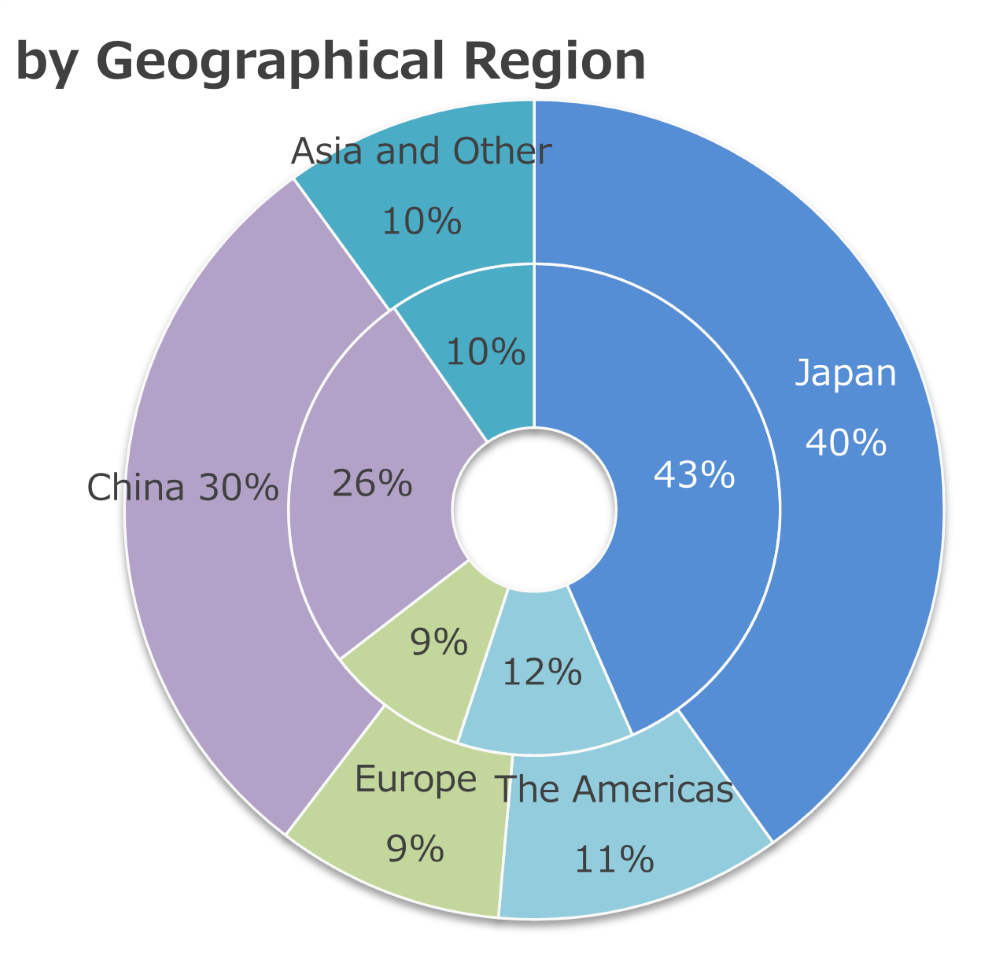
Consolidated Revenue
Inside: FY2024 222.7 billion yen
Outside: FY2025 240.4 billion yen
Breakdown of Unconsolidated Net Sales
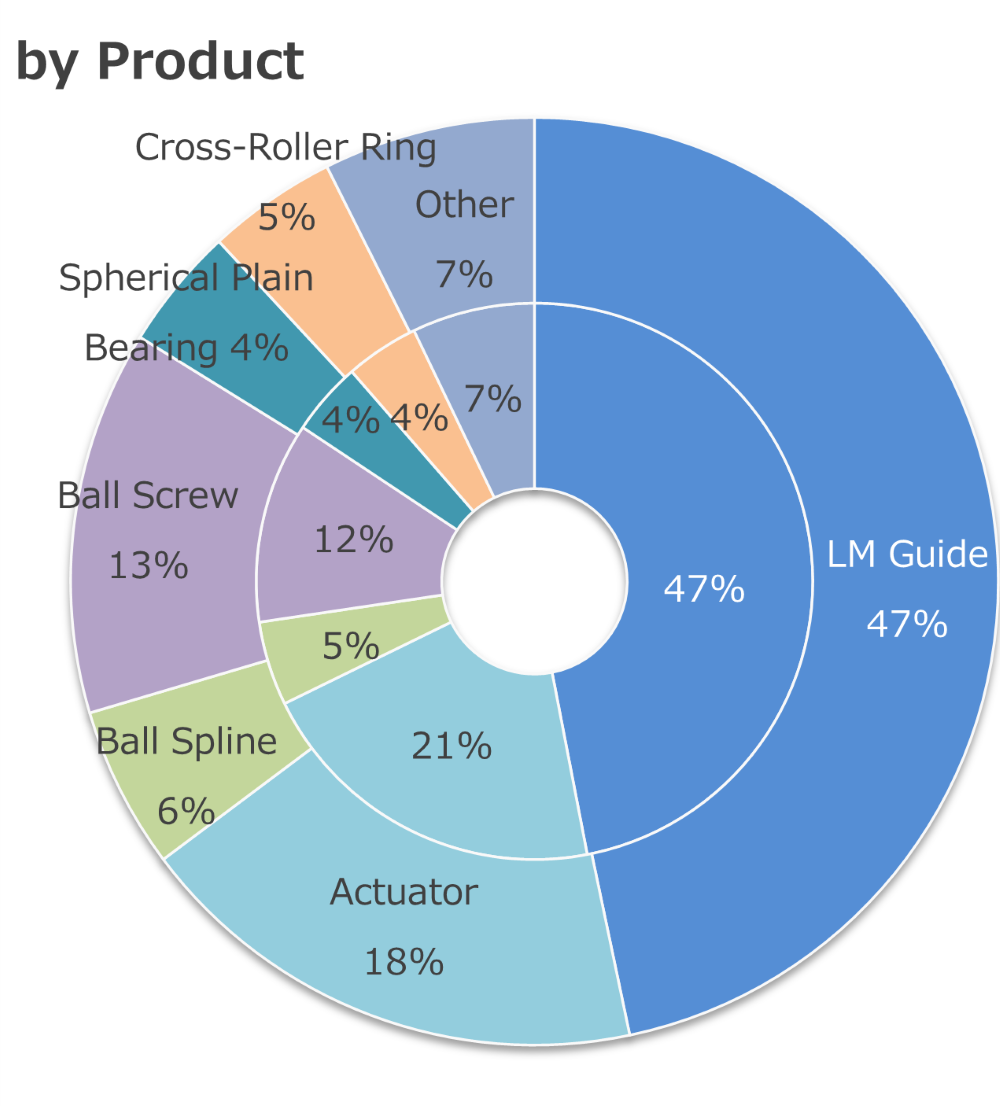
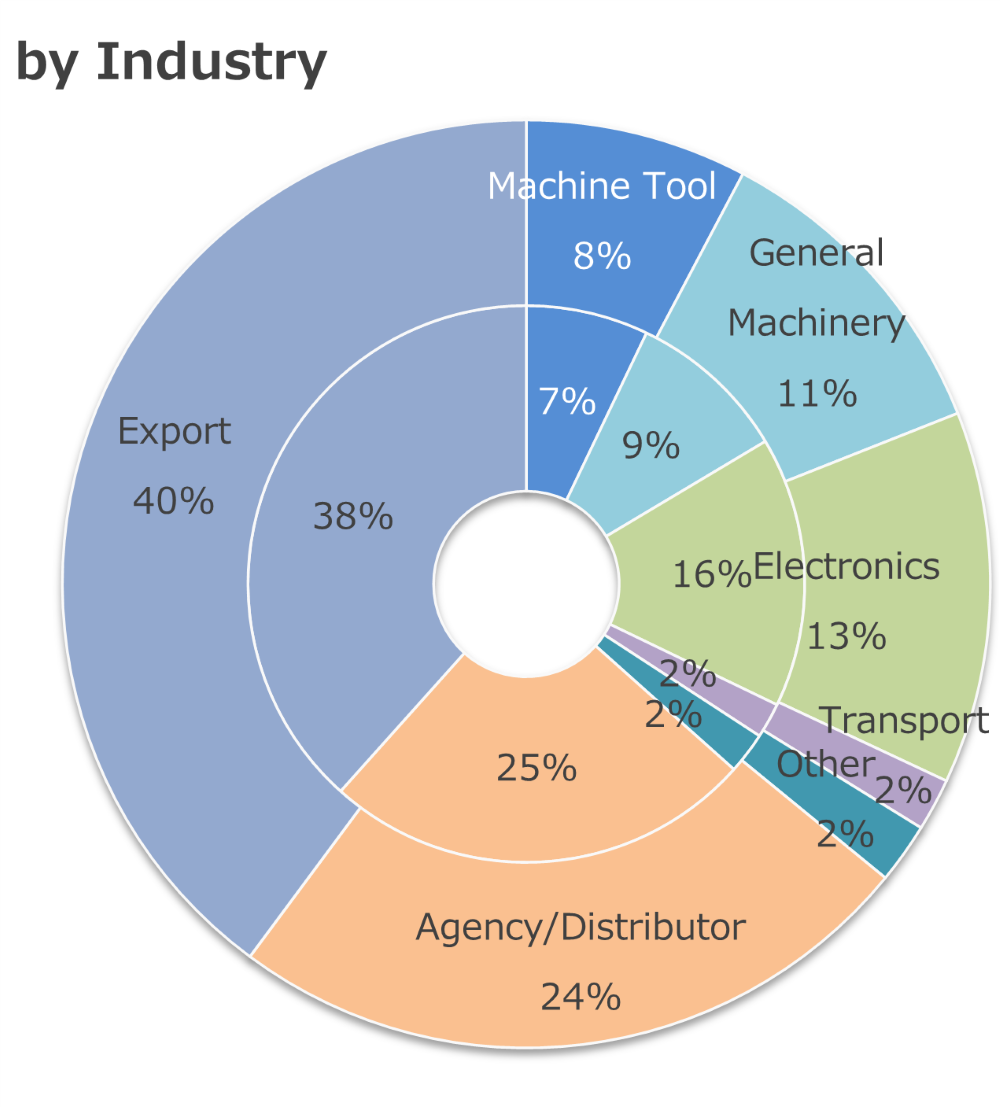
Unconsolidated Net Sales
Inside: FY2024 144.7 billion yen
Outside: FY2025 145.0 billion yen
Consolidated Performance Overview
|
'21/12 |
'22/12 |
'23/12 |
'24/12 |
'25/12 |
|
| Revenue |
318,188 |
393,687 |
351,939 |
222,737 |
240,444 |
|---|---|---|---|---|---|
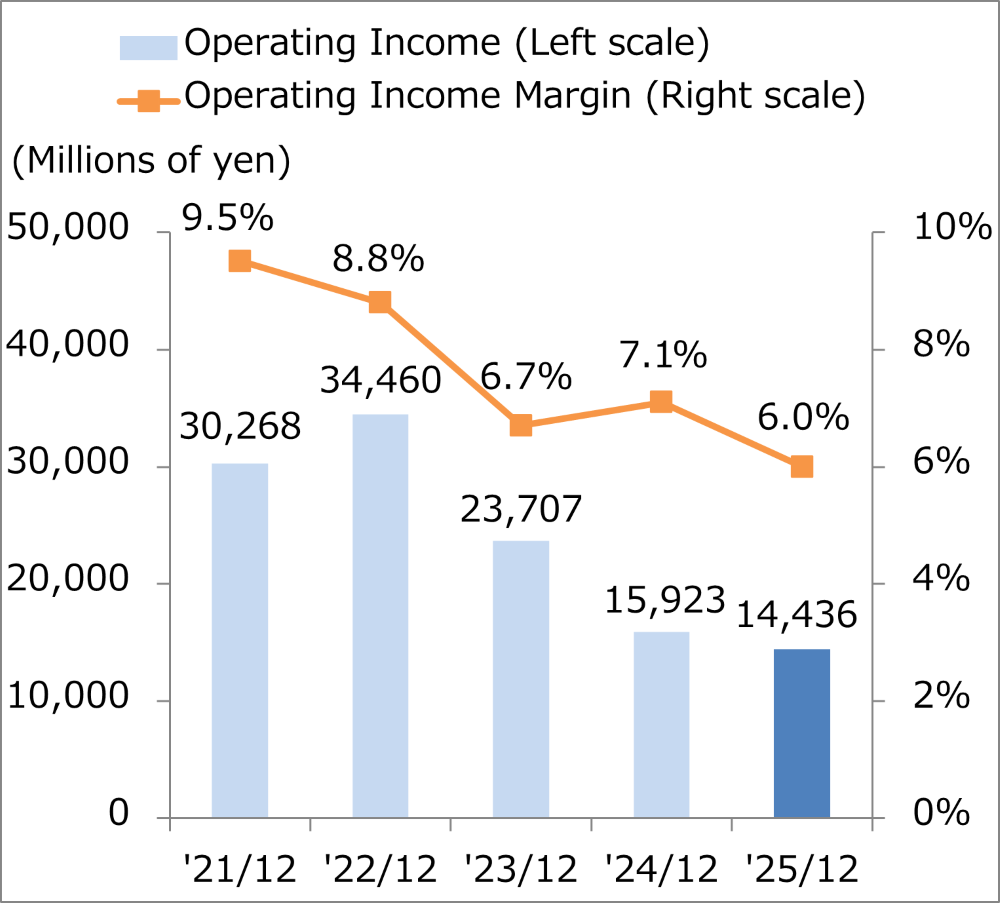
| Operating Income |
30,268 |
34,460 |
23,707 |
15,923 |
14,436 |
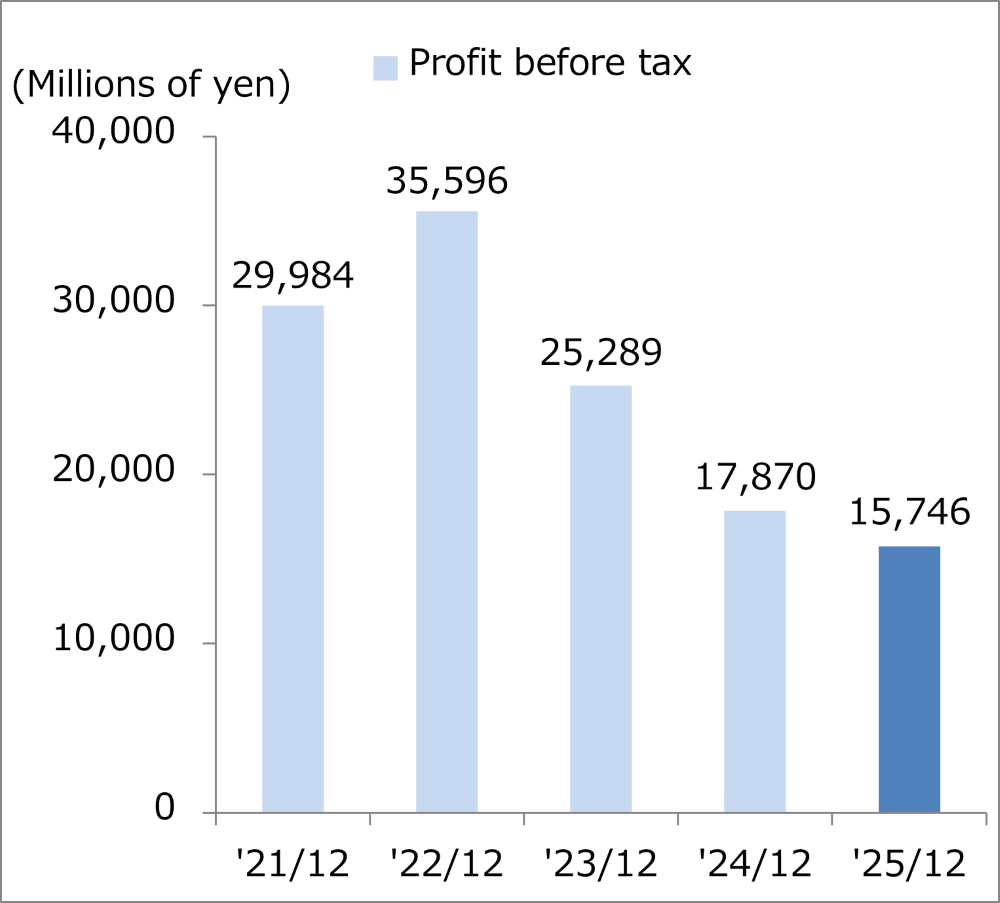
| Profit before Tax |
29,984 |
35,596 |
25,289 |
17,870 |
15,746 |
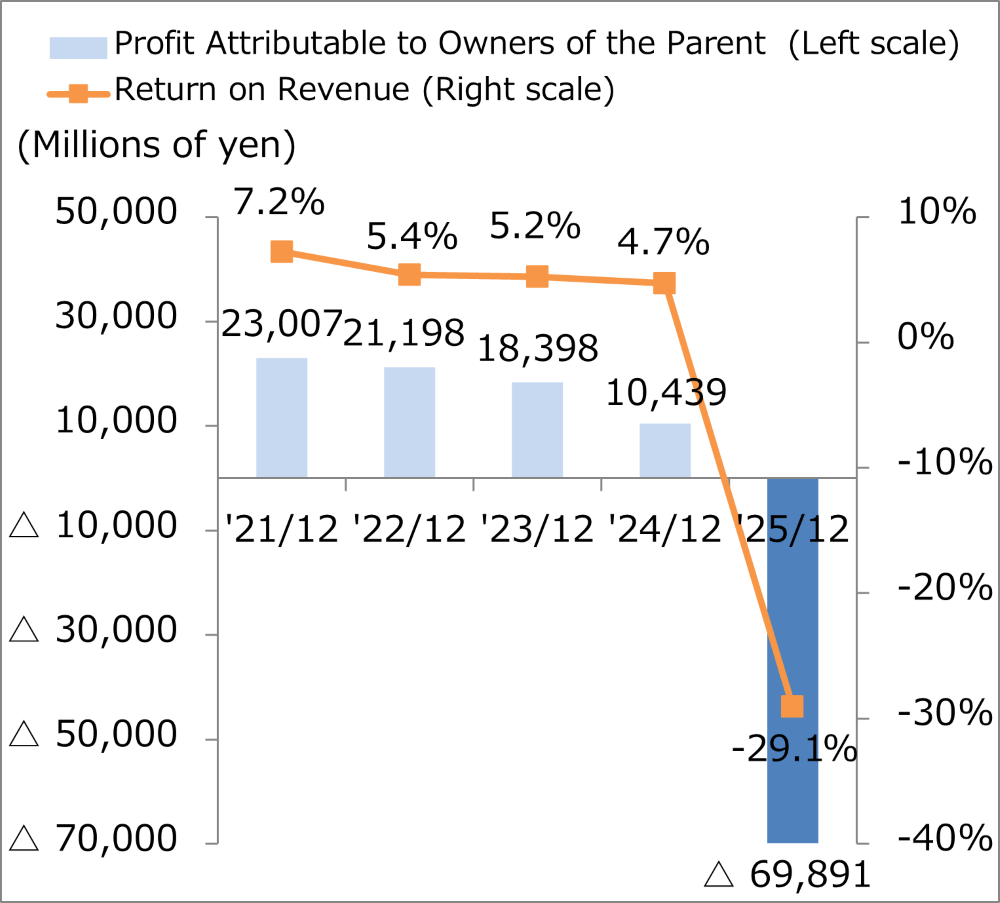
| Profit Attributable to Owners of the Parent |
23,007 |
21,198 |
18,398 |
10,439 |
|
| Total Equity |
314,289 |
337,281 |
362,898 |
389,795 |
265,749 |
| Total Assets |
516,086 |
560,304 |
556,351 |
567,418 |
472,992 |