Major Financial Data
*Effective from the fiscal year ending December 2025, the Transportation Equipment Business has been classified as a discontinued operation. Accordingly, capital expenditures, depreciation, and research and development expenses are presented based on continuing operations and exclude amounts related to the discontinued operation. Furthermore, ROA, inventory turnover in months, and total asset turnover are not disclosed, as the change in business segmentation makes it difficult to ensure continuity and comparability with previously reported figures.
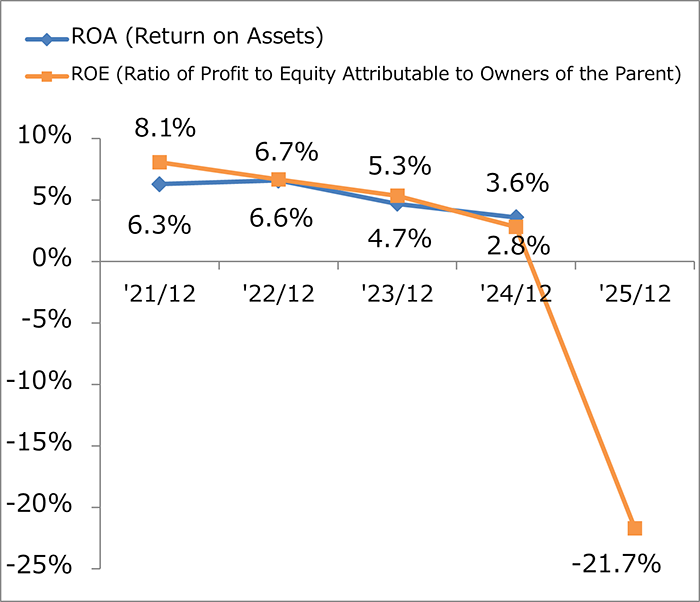
ROA, ROE
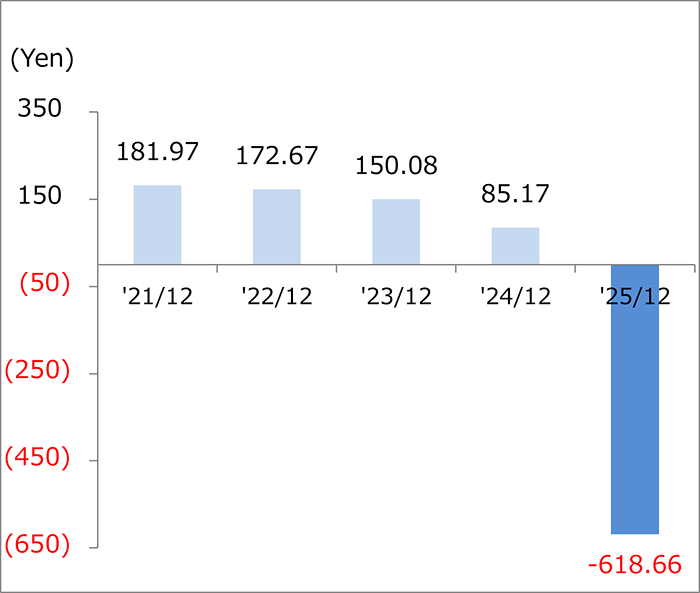
Earnings per Share
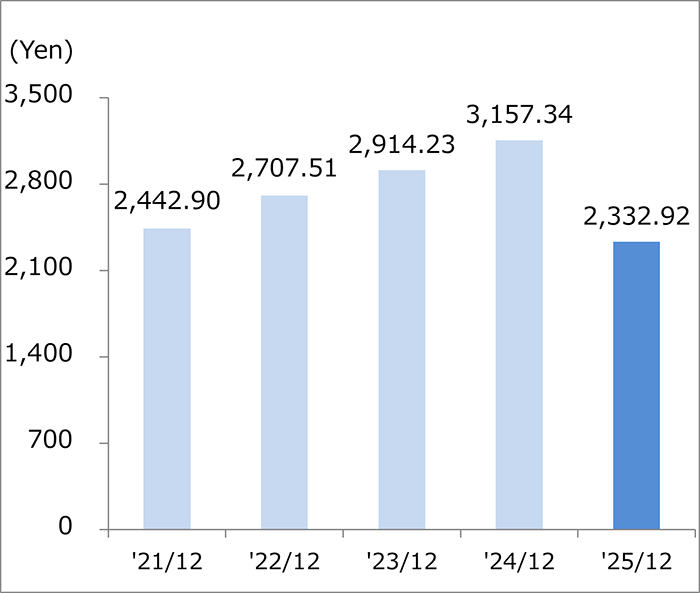
Equity Attributable to Owners of the Parent per Share
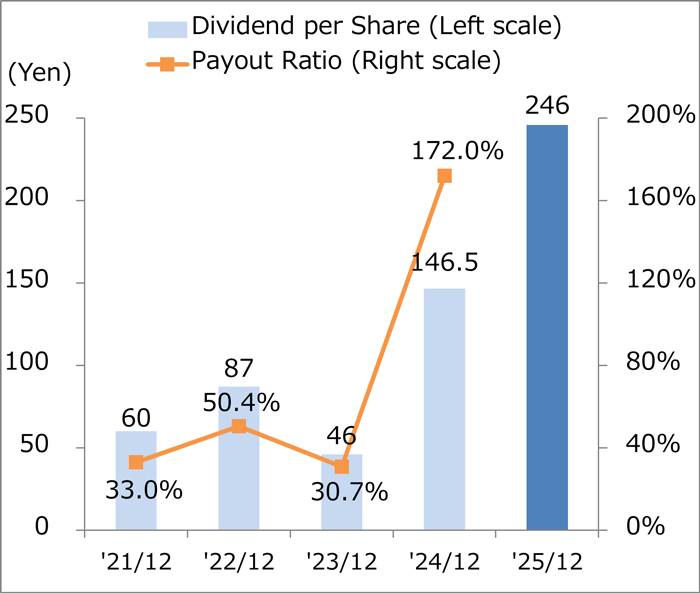
Dividend per Share, Payout Ratio
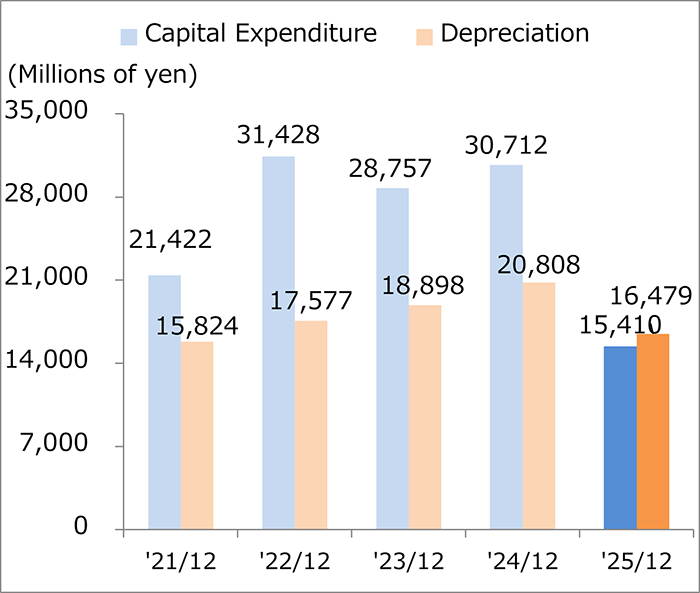
Capital Expenditure, Depreciation
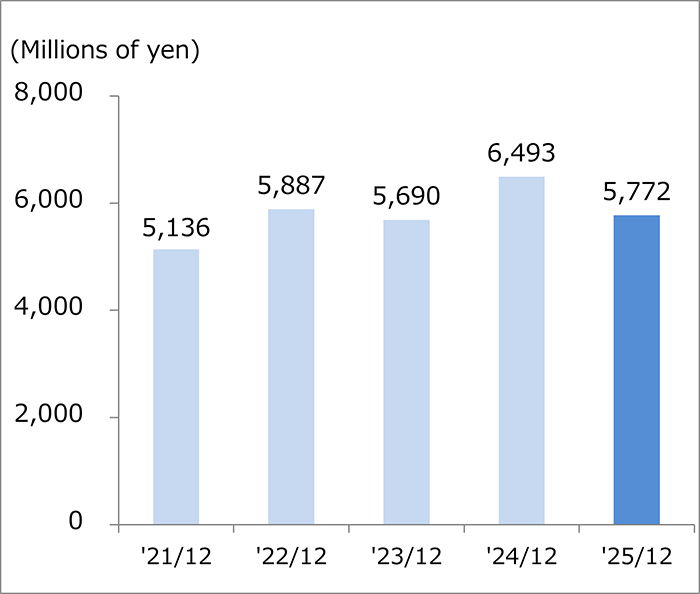
R&D Expenses
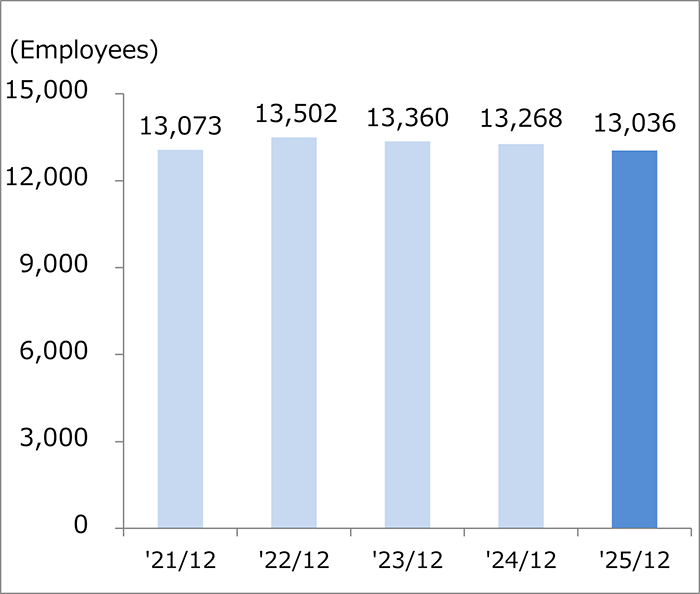
Number of Employees
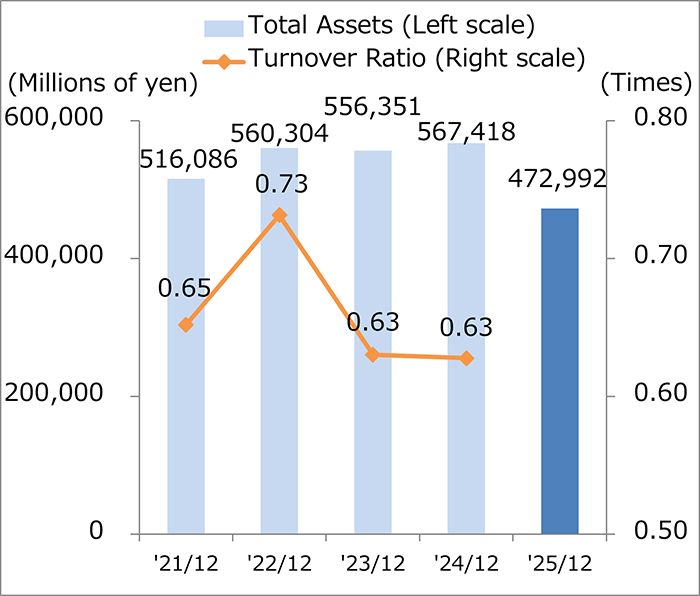
Total Assets, Turnover Ratio
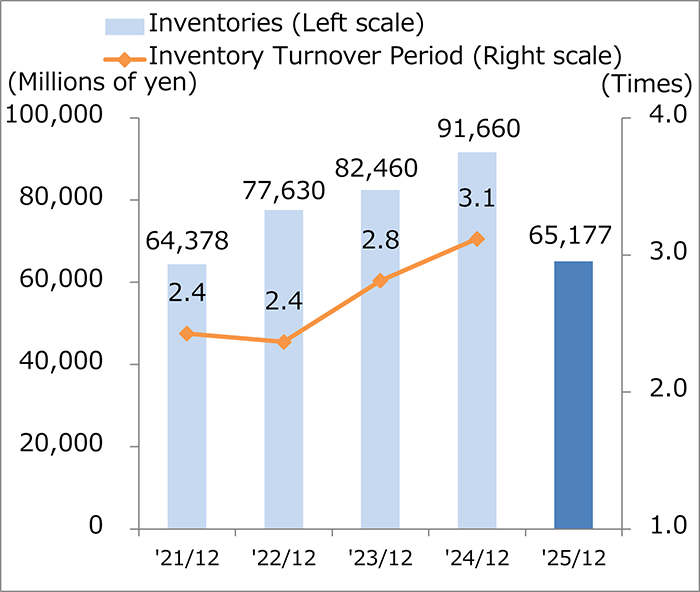
Inventories, Inventory Turnover Period (Months)
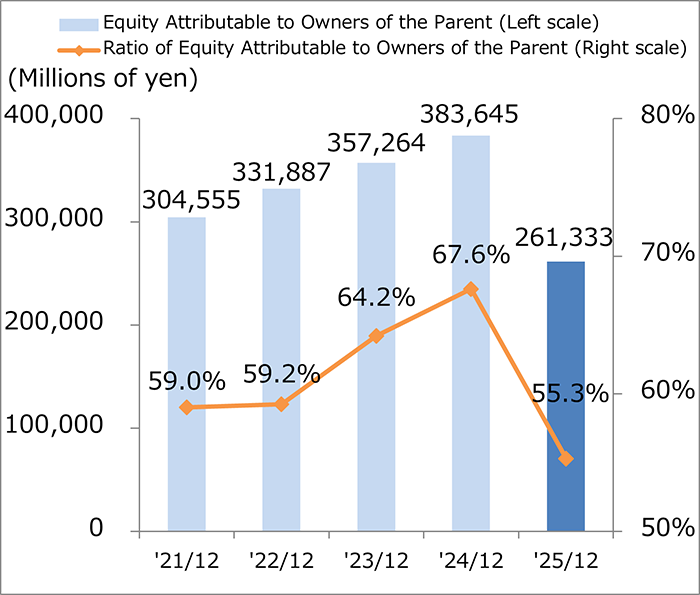
Ratio of Equity Attributable to Owners of the Parent
'21/12 |
'22/12 |
'23/12 |
'24/12 |
'25/12 |
|
|---|---|---|---|---|---|
ROA (Return on Assets) |
6.3% |
6.6% |
4.7% |
3.6% |
- |
ROE (Ratio of Profit to Equity Attributable to Owners of the Parent) |
8.1% |
6.7% |
5.3% |
2.8% |
△ 21.7% |
Earnings per Share |
181.97 |
172.67 |
150.08 |
85.17 |
△ 618.66 |
Equity Attributable to Owners of the Parent per Share |
2,442.90 |
2,707.51 |
2,914.23 |
3,157.34 |
2,332.92 |
Dividend per Share |
60 |
87 |
46 |
146.5 |
246 |
Payout Ratio |
33.0% |
50.4% |
30.7% |
172.0% |
- |
Capital Expenditure |
21,422 |
31,428 |
28,757 |
30,712 |
15,410 |
Depreciation |
15,824 |
17,577 |
18,898 |
20,808 |
16,479 |
R&D Expenses |
5,136 |
5,887 |
5,690 |
6,493 |
5,772 |
Number of Employees |
13,073 |
13,502 |
13,360 |
13,268 |
13,036 |
Turnover Ratio |
0.65 |
0.73 |
0.63 |
0.63 |
- |
Inventory Turnover Period (Months) |
2.4 |
2.4 |
2.8 |
3.1 |
- |
Ratio of Equity Attributable to Owners of the Parent |
59.0% |
59.2% |
64.2% |
67.6% |
55.3% |