Performance Overview
*The THK Group decided to adopt IFRS beginning with the 2019 fiscal year.
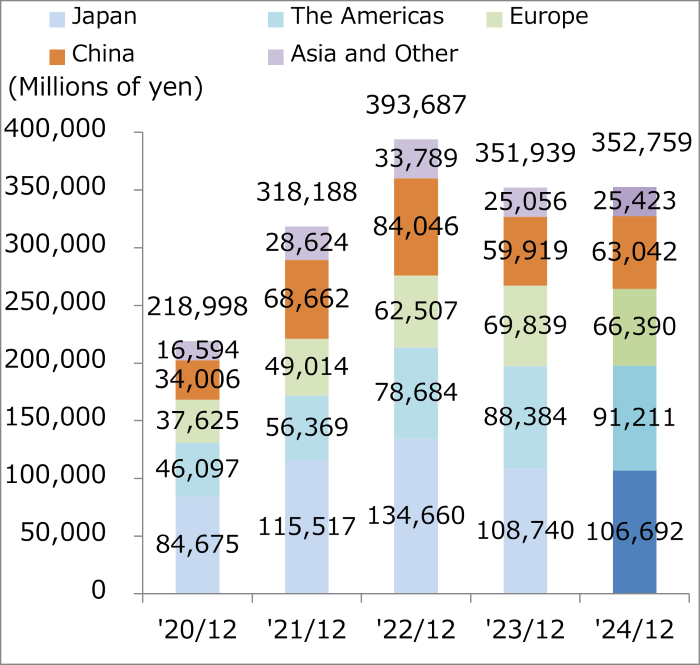
Breakdown of Consolidated Revenue
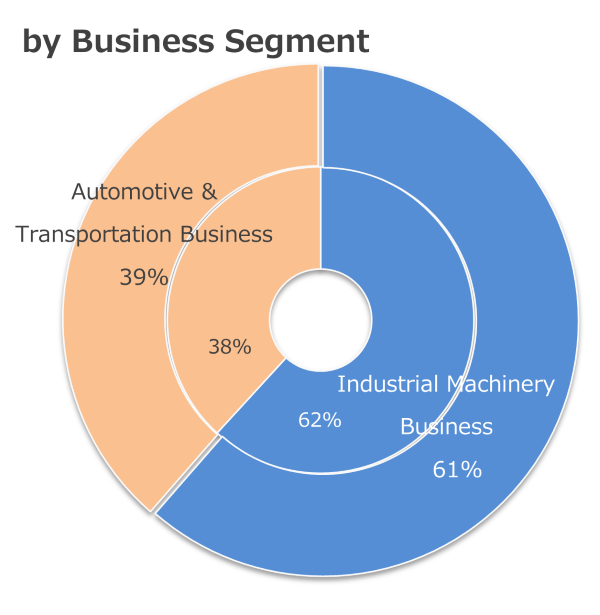
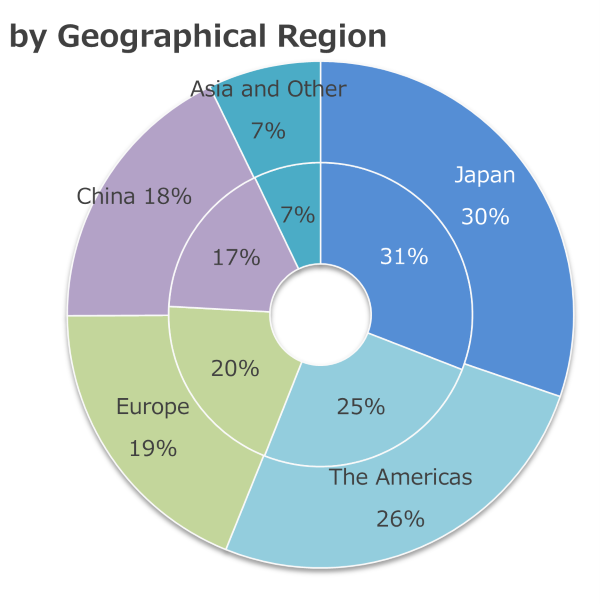
Consolidated Revenue
Inside: FY2023 351.9 billion yen
Outside: FY2024 352.7 billion yen
Breakdown of Unconsolidated Net Sales
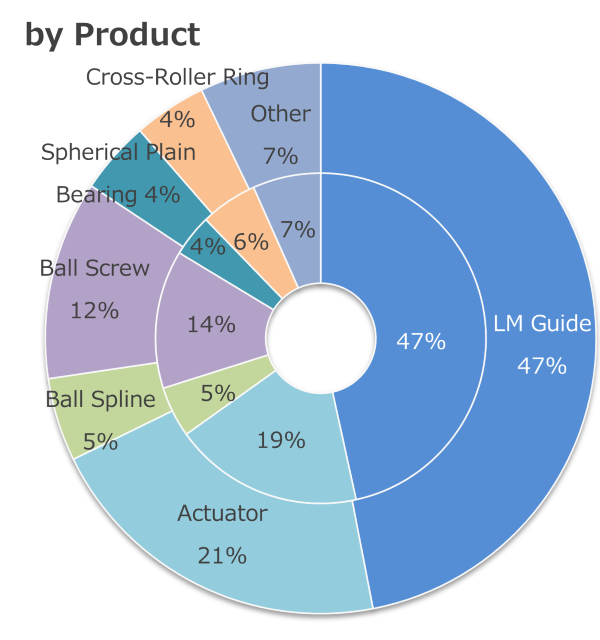
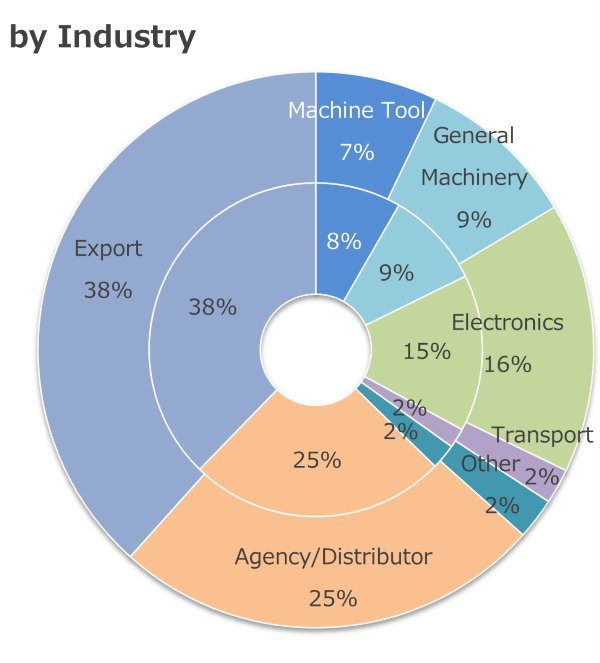
Unconsolidated Net Sales
Inside: FY2023 144.2 billion yen
Outside: FY2024 144.7 billion yen
Consolidated Performance Overview
Millions of yen
|
'20/12 |
'21/12 |
'22/12 |
'23/12 |
'24/12 |
|
| Revenue |
218,998 |
318,188 |
393,687 |
351,939 |
352,759 |
|---|---|---|---|---|---|
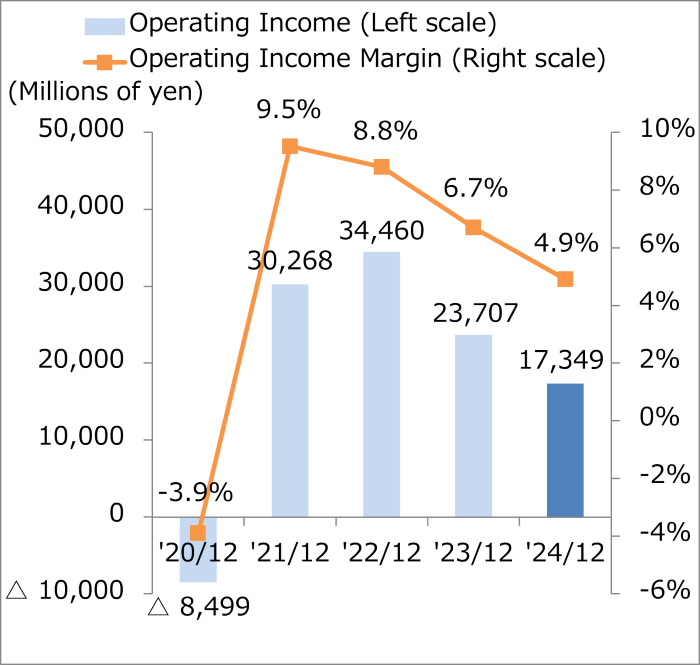
| Operating Income |
|
30,268 |
34,460 |
23,707 |
17,349 |
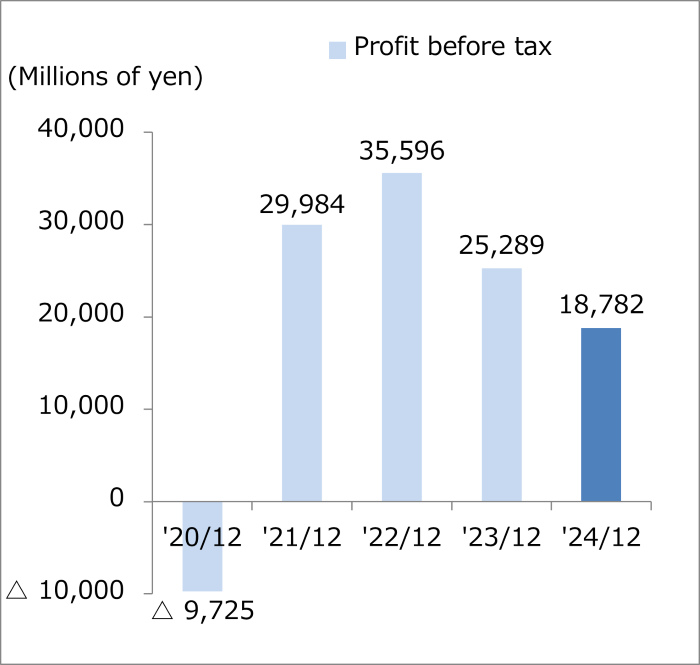
| Profit before Tax |
|
29,984 |
35,596 |
25,289 |
18,782 |
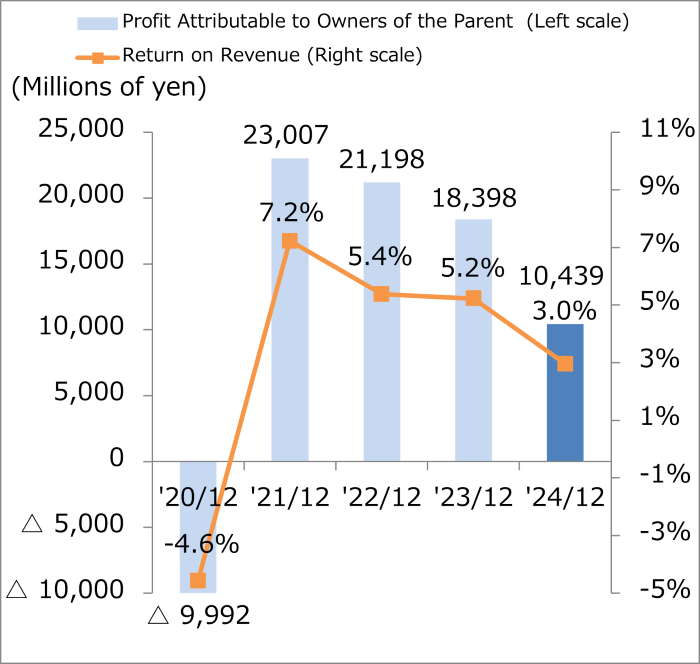
| Profit Attributable to Owners of the Parent |
|
23,007 |
21,198 |
18,398 |
10,439 |
| Total Equity |
275,148 |
314,289 |
337,281 |
362,898 |
389,795 |
| Total Assets |
460,173 |
516,086 |
560,304 |
556,351 |
567,418 |