Major Financial Data
*The THK Group decided to adopt IFRS beginning with the 2019 fiscal year.
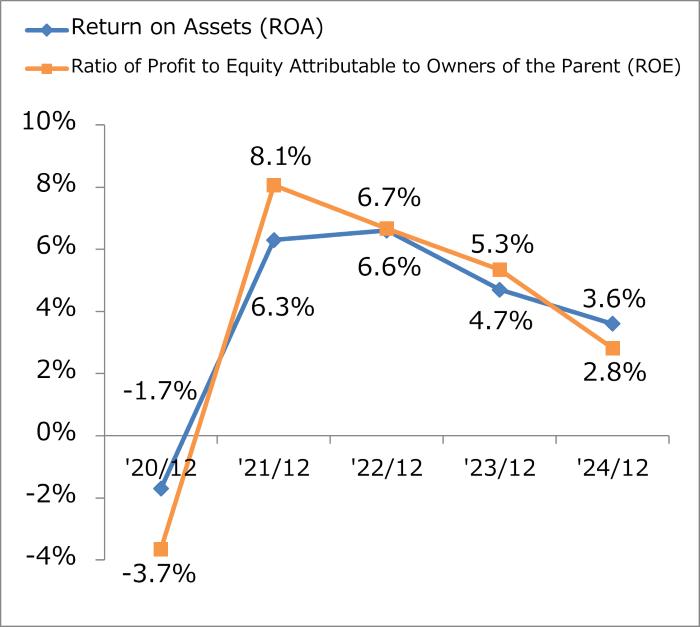
ROA, ROE
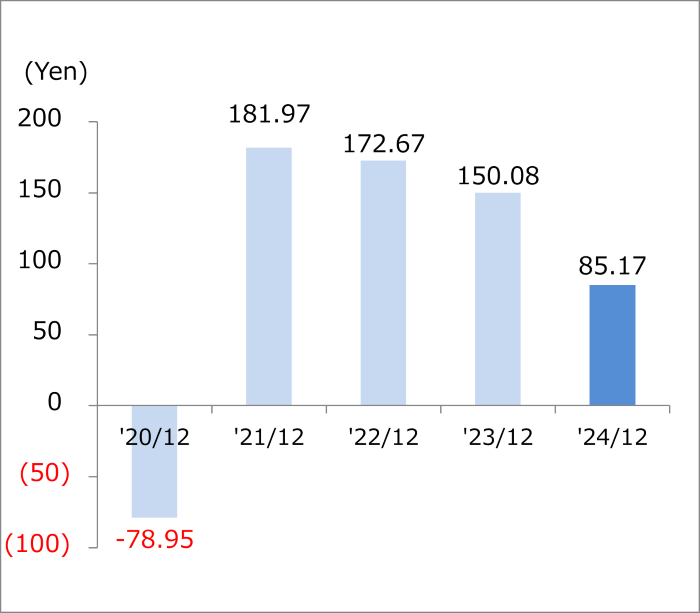
Earnings per Share
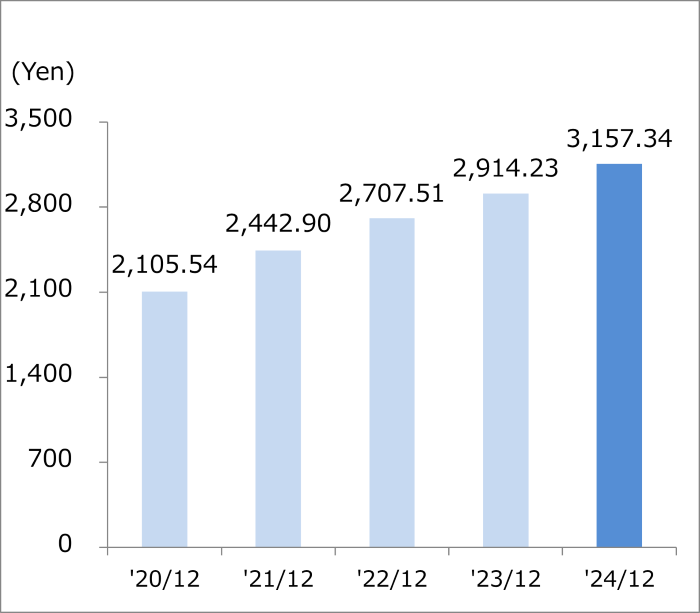
Equity Attributable to Owners of the Parent per Share
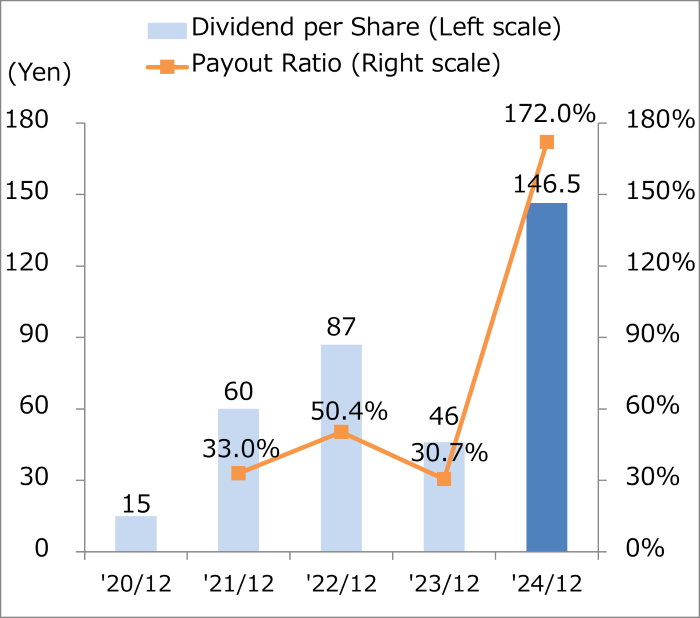
Dividend per Share, Payout Ratio
Capital Expenditure, Depreciation
R&D Expenses
Number of Employees at End of Periods
Total Assets, Turnover Ratio
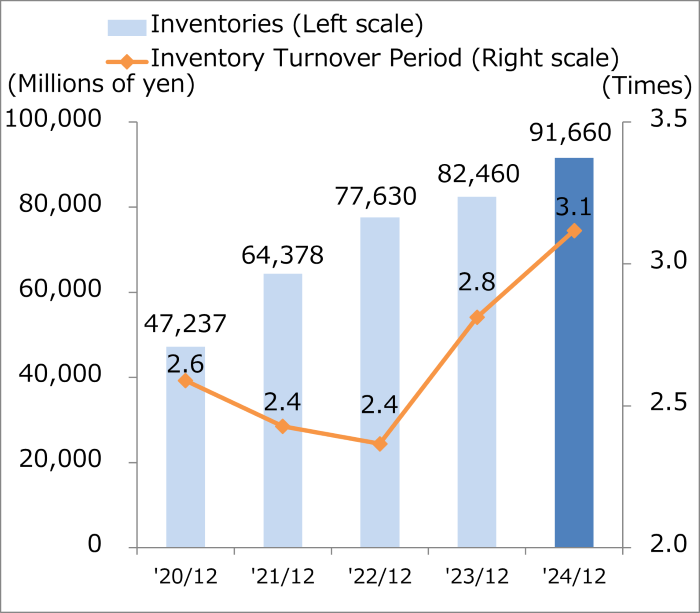
Inventory, Inventory Turnover Period (Months)
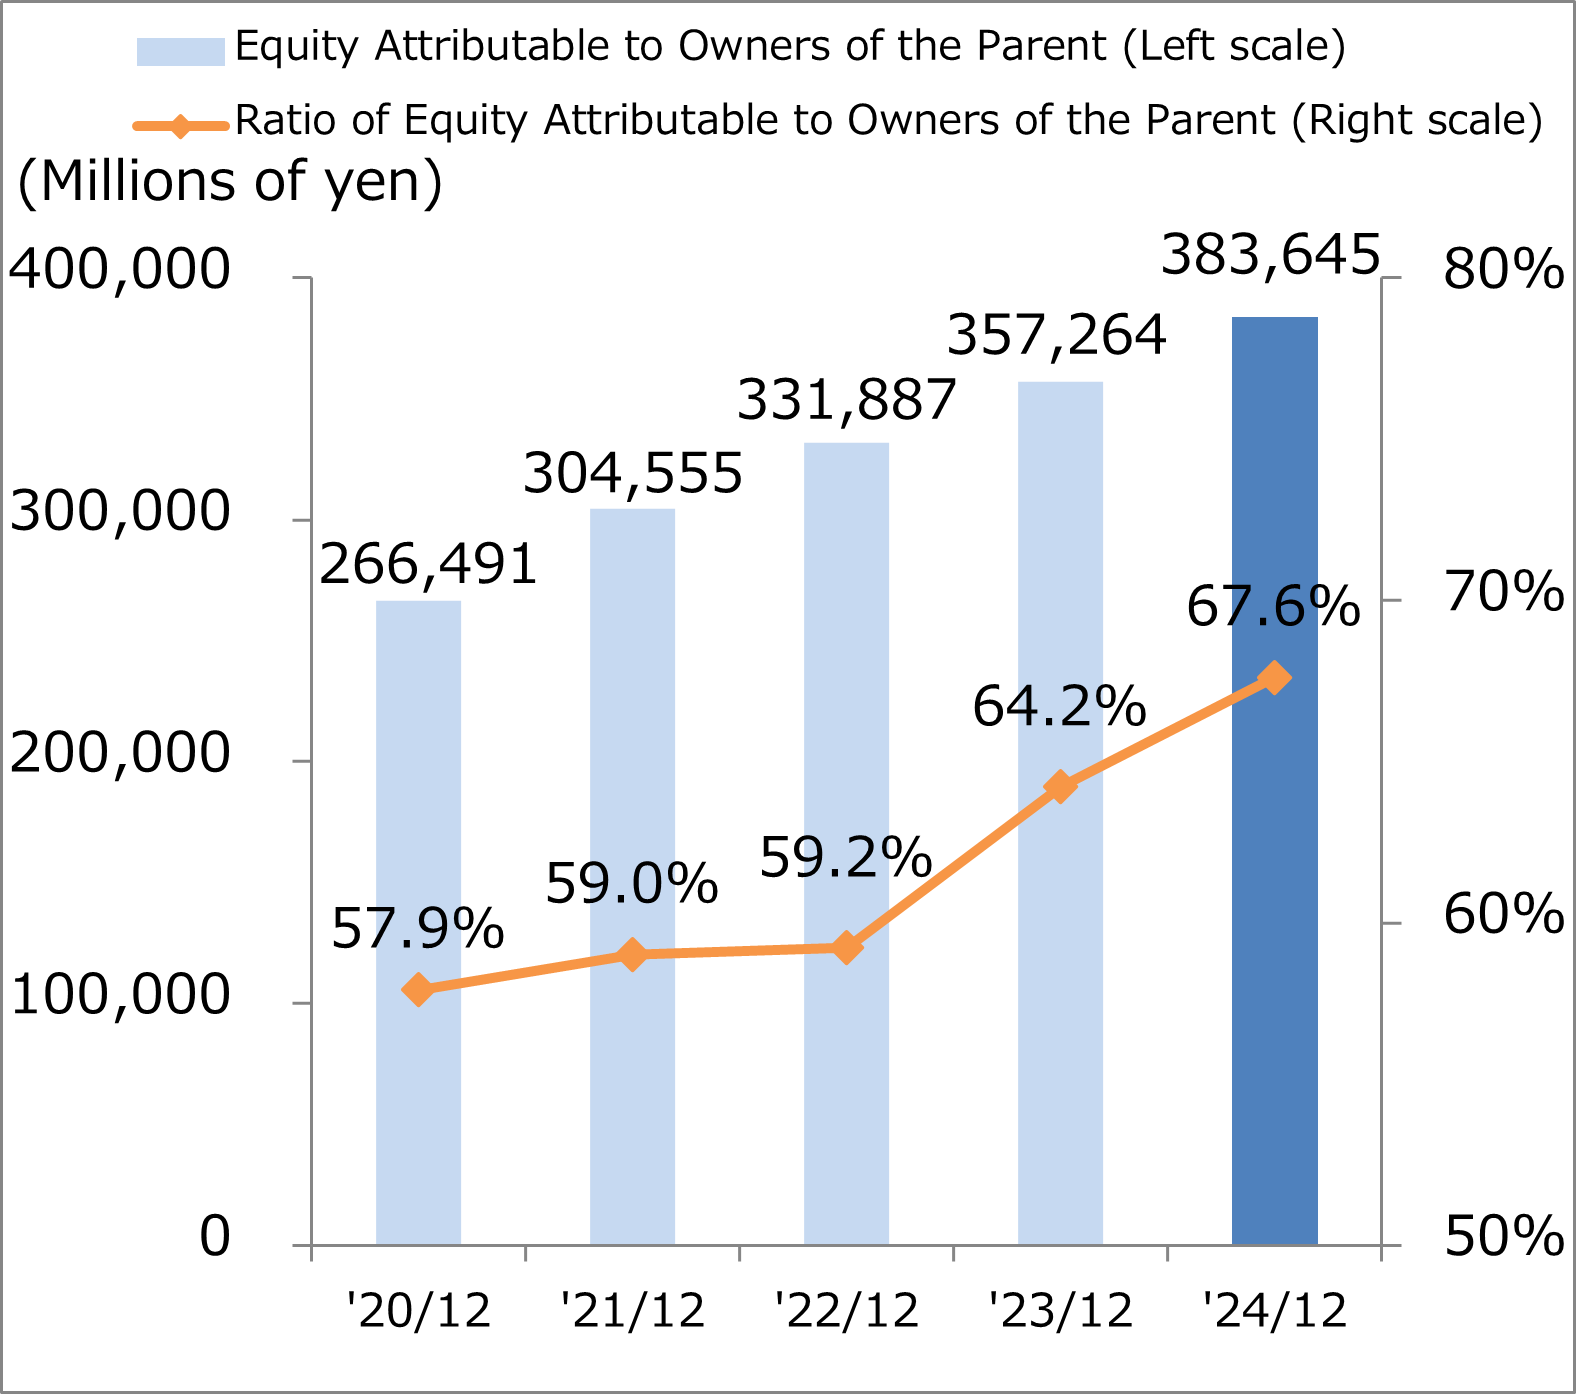
Ratio of Equity Attributable to Owners of the Parent
|
'20/12 |
'21/12 |
'22/12 |
'23/12 |
'24/12 |
|
|
Return on Assets (ROA) |
|
6.3% |
6.6% |
4.7% |
3.6% |
|---|---|---|---|---|---|
|
Ratio of Profit to Equity Attributable to Owners of the Parent (ROE) |
|
8.1% |
6.7% |
5.3% |
2.8% |
|
Earnings per Share |
|
181.97 |
172.67 |
150.08 |
85.17 |
|
Equity Attributable to Owners of the Parent per Share |
2,105.54 |
2,442.90 |
2,707.51 |
2,914.23 |
3,157.34 |
|
Dividend per Share |
15 |
60 |
87 |
46 |
146.5 |
|
Payout Ratio |
- |
33.0% |
50.4% |
30.7% |
172.0% |
|
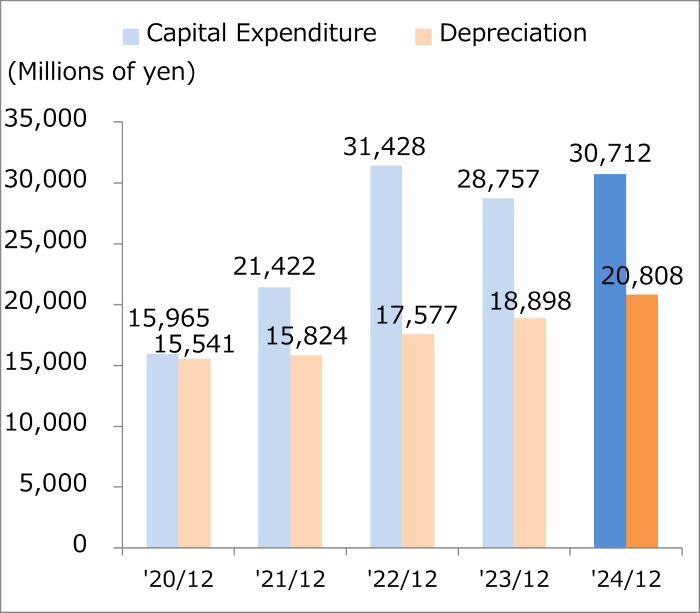
Capital Expenditure |
15,965 |
21,422 |
31,428 |
28,757 |
30,712 |
|
Depreciation |
15,541 |
15,824 |
17,577 |
18,898 |
20,808 |
|
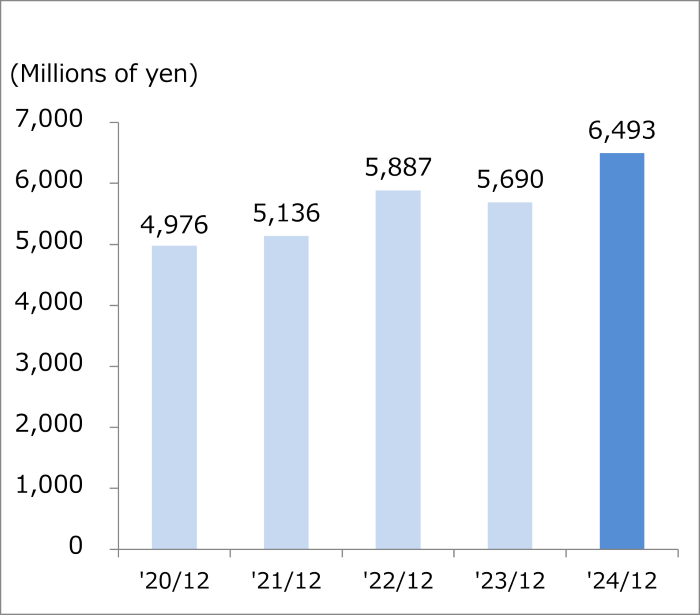
R&D Expenses |
4,976 |
5,136 |
5,887 |
5,690 |
6,493 |
|
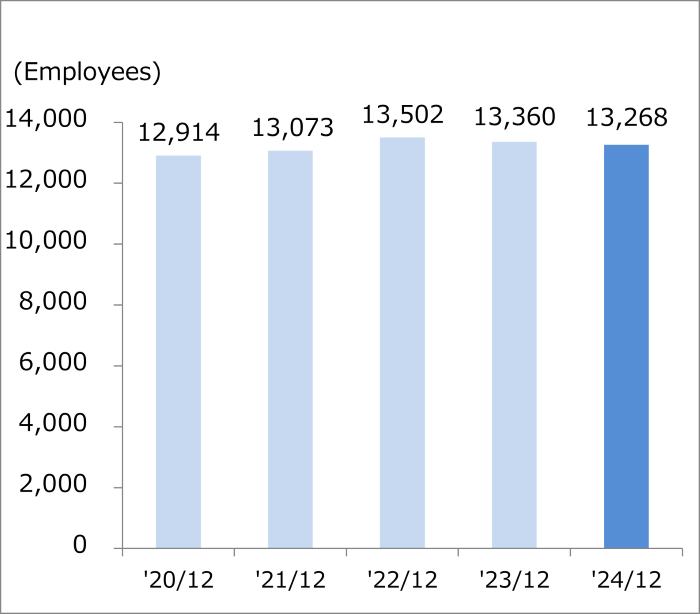
Number of Employees at End of Periods |
12,914 |
13,073 |
13,502 |
13,360 |
13,268 |
|
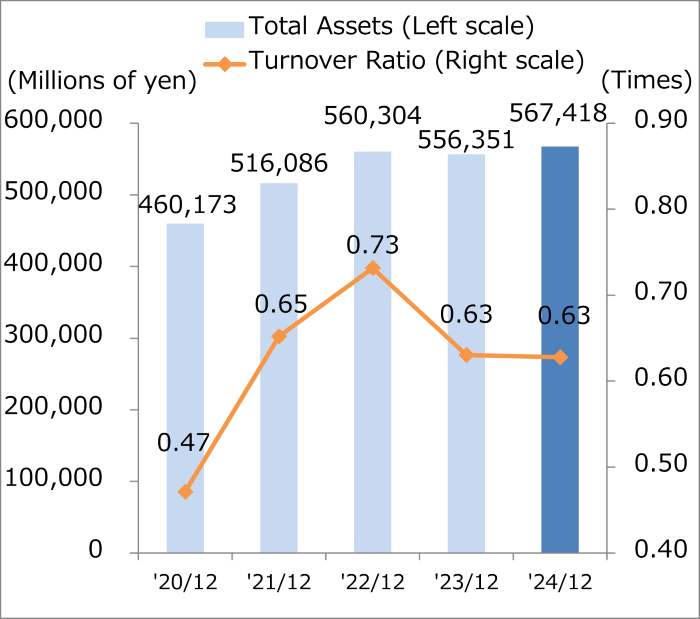
Turnover Ratio |
0.47 |
0.65 |
0.73 |
0.63 |
0.63 |
|
Inventory Turnover Period (Months) |
2.6 |
2.4 |
2.4 |
2.8 |
3.1 |
|
Ratio of Equity Attributable to Owners of the Parent |
57.9% |
59.0% |
59.2% |
64.2% |
67.6% |